
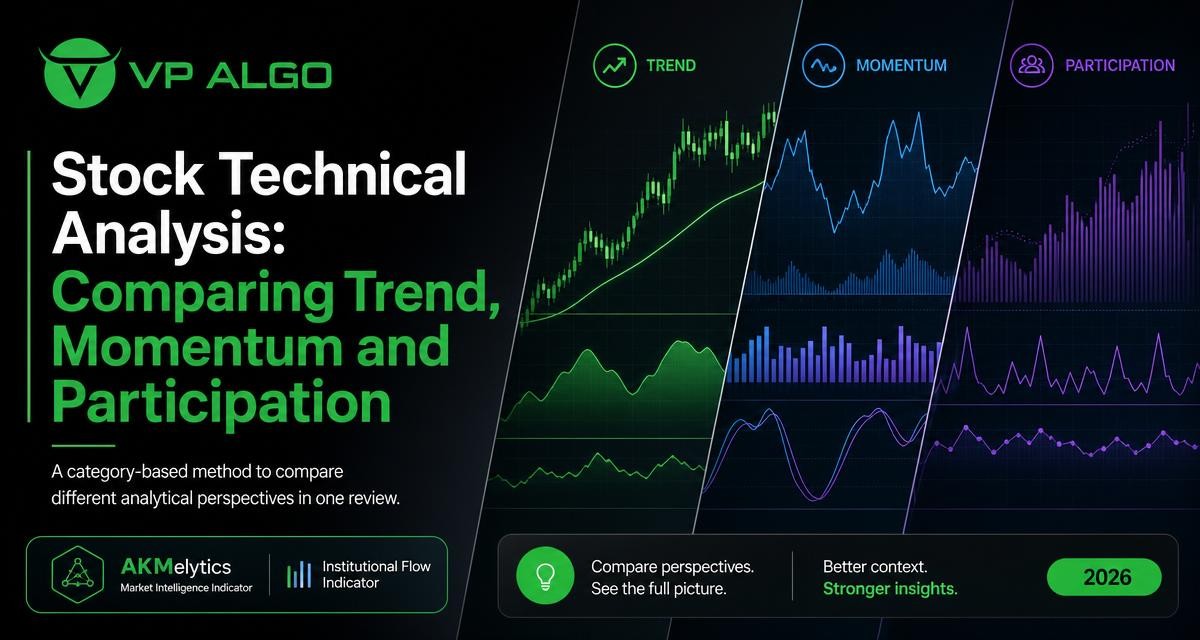
Stock technical analysis becomes more useful when it is treated as a process of comparing different market perspectives rather than searching for one perfect signal. Trend shows the market’s broad direction, momentum describes the strength behind price movement, and participation provides clues about whether activity is supporting that movement. Reviewing these categories together can help traders organize a chart before considering a potential setup.
Why compare several perspectives in stock technical analysis?
Price can move for different reasons, and a single chart feature rarely explains the entire market condition. A rising price may be part of a sustained trend, a short-lived momentum burst, or a move occurring near an important structural level. Without separating these ideas, traders may mistake speed for strength or interpret a temporary move as a lasting change in direction.
A category-based review creates a clearer sequence. First, assess the broader trend. Next, examine whether momentum agrees with that trend. Then review market structure and participation for additional context. This does not turn analysis into a guaranteed prediction, but it can make the reasoning behind a chart review more consistent and easier to evaluate.
The four analytical categories to review
| Category | Main question | What it can add to a review | Important limitation |
|---|---|---|---|
| Trend | Which direction has price generally been taking? | Broad directional context and a way to distinguish rising, falling or less decisive conditions | A trend can weaken, pause or reverse |
| Momentum | How forcefully is price moving? | Context about acceleration, persistence or loss of movement | Strong momentum can also occur near exhaustion |
| Market structure | How are swings, breaks and key levels arranged? | A framework for interpreting highs, lows, support, resistance and possible changes in behavior | Structure can look different across timeframes |
| Participation | Is market activity supporting the price movement? | Additional context about activity, institutional flow concepts and smart money analysis | Participation tools do not reveal certainty about future actions |
The purpose of the table is not to rank one category above another. Each category answers a different question. A trend indicator may help describe direction, while a momentum indicator for TradingView may help assess movement strength. A market structure indicator adds a framework for swing behavior, and an institutional flow indicator can contribute another perspective on participation.
1. Trend: establish the broader direction
Trend analysis is usually the starting point because it provides a basic map of the chart. The review may ask whether price is forming a sequence that appears generally higher, generally lower or relatively mixed. It can also consider whether a shorter-term move agrees with the broader timeframe or is moving against it.
Trend should not be treated as a permanent label. A rising market can enter a range, and a falling market can experience a temporary recovery. For that reason, stock technical analysis works better when trend is reviewed as current context rather than as a fixed forecast. Multi-timeframe trend assessment can help traders see whether different chart views are aligned or describing different phases.
Questions for trend analysis
- Is the broader price direction rising, falling or unclear?
- Does the shorter-term movement agree with the wider trend?
- Has price recently moved into a range or shown signs of changing behavior?
- Are important swing highs and lows supporting the same directional view?
2. Momentum: measure movement strength without confusing it with direction
Momentum and trend are related, but they are not identical. Trend addresses direction over a period of time. Momentum focuses more closely on the force and pace of movement. A market can remain in an upward trend while momentum fades, or it can show a sudden momentum surge before the broader trend has changed.
When reviewing momentum, consider whether the indicator is confirming an existing move, recovering from weakness or diverging from price behavior. Momentum can be useful for identifying changing conditions, but it should not be read in isolation. A strong reading does not automatically mean that a move will continue, and a weaker reading does not by itself prove that a reversal is underway.
Questions for momentum analysis
- Is momentum increasing, decreasing or staying relatively stable?
- Does momentum agree with the current trend?
- Is a sharp movement occurring near a significant structural level?
- Could the reading reflect a temporary burst rather than a durable change?
3. Market structure: put price movement into context
Market structure focuses on how price develops through swings, breaks and reactions around important levels. Instead of asking only whether a line is rising or falling, structural analysis considers how recent highs and lows relate to one another. This can make a chart review more specific because it connects the current price to earlier areas of interest.
A market structure indicator may help organize concepts such as swing points, structural breaks and changes in behavior. These labels still require interpretation. A break on one timeframe may be less meaningful when viewed against a wider chart, while a reaction around a previous level may deserve closer attention than an isolated price movement.
Questions for market structure
- What are the most recent meaningful swing highs and swing lows?
- Has price broken or respected a level that previously influenced movement?
- Does the current structure support the trend assessment?
- Are different timeframes showing the same structure or conflicting views?
4. Participation: examine activity behind the move
Participation analysis adds another layer to stock technical analysis by asking whether market activity appears to support the price movement. Terms such as institutional flow and smart money concepts are often used to describe this perspective. An institutional flow indicator can contribute contextual information, but it should not be interpreted as direct access to every institutional order or as proof of what a particular market participant will do next.
Participation is most useful when it is compared with trend, momentum and structure. For example, a price move may look technically strong, while participation-related information appears less supportive. That difference does not produce an automatic buy or sell conclusion. Instead, it identifies an area where the trader may need to slow down, review the chart and define what evidence would confirm or weaken the original interpretation.
Questions for participation analysis
- Does activity appear consistent with the direction of price?
- Is participation changing while price continues in the same direction?
- Does the participation perspective agree with the market structure?
- Could the reading be sensitive to timeframe, volatility or the way the indicator defines activity?
How to compare the categories on one chart
A practical comparison does not require every category to produce the same signal at the same moment. Markets often contain mixed information. The value comes from identifying where the perspectives agree, where they conflict and what remains uncertain.
- Start with the wider trend. Describe the broad directional condition without immediately turning it into a trade idea.
- Review the current timeframe. Check whether the shorter-term price action supports or challenges the wider view.
- Assess momentum. Decide whether movement is strengthening, fading or behaving inconsistently with the trend.
- Map market structure. Identify relevant swings, breaks and areas where price has reacted.
- Review participation. Compare institutional-flow or smart-money context with what price, trend and momentum are showing.
- Record disagreement. Treat conflicting categories as information, not as a problem that must be forced into a simple answer.
This process can be documented in a short review table. The goal is to make the trader’s reasoning visible before any decision is considered.
| Review area | Observation | Agreement or conflict | Follow-up question |
|---|---|---|---|
| Trend | Broad directional condition | Does momentum support it? | Is the direction consistent across selected timeframes? |
| Momentum | Strength or loss of movement | Does structure confirm it? | Could the move be temporary or extended? |
| Structure | Swings, breaks and key reactions | Does participation add context? | Which level would change the interpretation? |
| Participation | Activity and smart-money context | Does price behavior agree? | What remains unknown about the activity? |
Using a TradingView indicator as an analytical workspace
Traders who use TradingView may prefer an indicator that brings several analytical perspectives into one chart workspace. The AKMelytics – Market Intelligence Indicator is presented within this category of market analysis tools. Its intended use can be understood as helping traders review areas such as trend, momentum, market structure, institutional activity and smart money concepts in a more organized way.
That type of tool should support analysis rather than replace it. Traders still need to understand what each component represents, choose suitable timeframes, and decide how the information fits their own process. A TradingView trading indicator can reduce the need to switch repeatedly between separate chart studies, but convenience should not be confused with certainty or independent financial advice.
What to look for when evaluating an indicator
- Clarity: Can you understand what each signal or visual element is intended to represent?
- Category coverage: Does the tool address the perspectives you actually use, such as trend, momentum, structure and participation?
- Timeframe awareness: Can you compare broader and shorter-term conditions without losing context?
- Decision discipline: Does the tool encourage a defined review process rather than impulsive reactions?
- Practical support: Is installation, activation or usage assistance available when needed?
Common mistakes when comparing trend, momentum and participation
Treating every signal as a prediction
Indicators summarize selected price or market information. They do not remove uncertainty. A signal should be treated as part of an analytical review, not as a guarantee that a particular outcome will occur.
Ignoring timeframe differences
A daily trend and a shorter-term momentum reading can disagree without either being invalid. They may simply describe different parts of the market. Always record the timeframe attached to an observation.
Using confirmation as a reason to skip risk planning
Agreement among several categories can improve organization, but it does not eliminate trading risk. A structured review should still include clear conditions for changing the analysis and an approach to managing exposure that fits the trader’s own circumstances.
Overloading the chart
Adding more indicators does not automatically create better analysis. If several tools display similar information, they may add visual complexity without adding a new perspective. The strongest chart layout is usually one that helps you answer specific questions clearly.
A balanced framework for stock technical analysis
The most useful comparison is often not “which indicator is best?” but “which question does each tool answer?” Trend provides direction, momentum provides information about movement strength, market structure explains the arrangement of price swings, and participation adds context about activity. Keeping these roles separate makes it easier to identify confirmation and disagreement.
VP ALGO TRADING develops TradingView indicators and algorithmic trading tools for traders who want a structured way to examine market conditions. Its indicator offerings are intended for educational and trading-decision assistance, not as financial advice. Traders should evaluate any tool against their own knowledge, process and risk considerations, and should not assume that past observations guarantee future results.
Frequently asked questions
What is stock technical analysis?
Stock technical analysis is the study of price behavior and related market information to evaluate current conditions. It can include trend, momentum, market structure, participation and other chart-based perspectives.
What is the difference between trend and momentum?
Trend describes the general direction of price over a chosen period. Momentum focuses more on the strength or pace of movement. A market can have a continuing trend while momentum is increasing, fading or becoming mixed.
What does an institutional flow indicator do?
An institutional flow indicator provides a framework for reviewing activity-related information and concepts associated with institutional participation. It should be treated as contextual analysis, not as direct proof of future institutional actions.
Why include market structure in a chart review?
Market structure helps organize swing highs, swing lows, breaks and reactions around important levels. It adds context that can be missed when a trader looks only at a single trend or momentum reading.
Can one TradingView indicator replace a complete trading plan?
No. An indicator can help organize chart information, but it does not replace a trading plan, risk process, timeframe selection or the trader’s own judgment.
Is the AKMelytics indicator financial advice?
No. VP ALGO TRADING positions its indicators as tools for educational and trading-decision assistance rather than official financial advice. Users remain responsible for their own analysis and decisions.


Recent Comments