
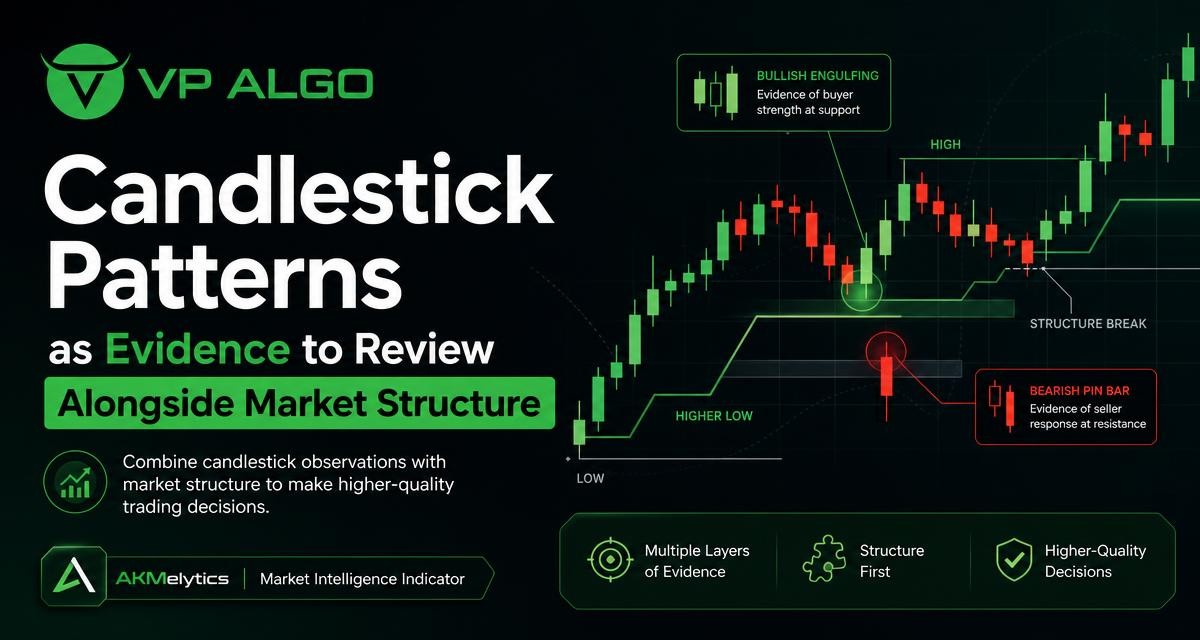
Candlestick patterns can help traders describe what price did during a specific period, but a single candle rarely provides enough evidence for a complete market view. A rejection wick, engulfing candle, or strong closing candle may be useful when it appears at a meaningful level and agrees with the broader structure. Reviewing candlestick patterns alongside market structure, momentum, trend, and other chart information creates a more disciplined way to assess potential setups.
What candlestick patterns actually show
A candlestick records the open, high, low, and close for a chosen timeframe. The body shows the distance between the open and close, while the wicks show where price moved before returning. This gives traders a compact view of buying and selling pressure during that period.
For example, a candle with a long lower wick and a close near its high may show that sellers pushed price lower but buyers responded before the session ended. A large bearish body may show decisive selling during that candle. These observations are useful, but they remain observations rather than automatic trade instructions.
| Candlestick observation | What it may suggest | What still needs review |
|---|---|---|
| Long upper wick | Price was rejected from higher levels during the period | Whether the rejection occurred at resistance or within an established uptrend |
| Long lower wick | Lower prices were rejected before the close | Whether nearby support held and whether the wider structure remains constructive |
| Large bullish body | Strong upward movement during the candle | Whether price is extending a trend or moving into a significant supply area |
| Large bearish body | Strong downward movement during the candle | Whether the move breaks structure or is simply a pullback |
| Small body or doji-like candle | Temporary balance or hesitation | What price does next and where the candle formed |
The key point is context. The same candle can carry different meaning depending on its location, timeframe, preceding movement, and relationship to important highs and lows.
Why one candle is not a complete trading signal
A common mistake is to treat a named pattern as a standalone prediction. A bullish engulfing candle, for instance, may appear after a decline, during a sideways range, or directly beneath a well-established resistance level. The shape is similar, but the surrounding conditions are not.
Candlestick patterns also appear frequently when markets are noisy. On a short timeframe, several opposing patterns may form within a small price range. If every pattern is treated as a signal, the chart can produce more decisions than useful information. A better approach is to ask whether the candle adds evidence to an existing market thesis.
Pattern names are descriptions, not guarantees
Terms such as pin bar, inside bar, engulfing candle, hammer, and shooting star are shorthand for recurring price shapes. They help traders communicate and organize observations. They do not guarantee that price will continue in the implied direction.
A pattern becomes more informative when it is connected to a clear question: Did buyers defend a previously important area? Did sellers reject a new high? Did the candle confirm a break, or did price close back inside the earlier range? Those questions are more useful than relying on the label alone.
Market structure provides the wider framework
Market structure refers to the way price forms and interacts with significant swing highs and swing lows. Traders often examine whether the market is making higher highs and higher lows, lower highs and lower lows, or moving between identifiable boundaries.
This framework helps distinguish a possible continuation from a possible reversal. A bullish candle during a sequence of higher highs and higher lows may fit the existing direction. The same candle after a prolonged decline may instead represent an early attempt to change direction, which requires more confirmation.
Questions to ask about structure
- Is price forming a series of higher highs and higher lows, lower highs and lower lows, or neither?
- Which swing high or swing low is currently most relevant?
- Has price actually broken a meaningful level, or only moved beyond a minor fluctuation?
- Did the candle close beyond the level, or did it leave a wick and return inside the range?
- Is the market trending, consolidating, or transitioning between conditions?
These questions prevent a trader from assigning too much importance to an isolated candle. They also make chart review more repeatable, because the trader is evaluating location and sequence rather than only appearance.
How candlestick patterns and structure work together
The most useful relationship is often sequential. Structure establishes the broader condition, price reaches an area that matters within that condition, and the candlestick pattern provides information about the latest reaction.
Consider a market that has been forming higher highs and higher lows. If price pulls back toward a prior swing area and creates a strong bullish close, the candle may support the idea that buyers are responding at that location. It does not prove that the trend will continue, but it gives the trader evidence to compare with the structure.
In a declining market, a bearish rejection candle near a lower high may fit the existing structure more naturally than a bullish candle that appears in the middle of a downward move. The pattern is not being ignored; it is being weighted according to where and when it formed.
| Market condition | Useful candlestick question | Interpretation to avoid |
|---|---|---|
| Established uptrend | Does the candle show demand returning near a relevant pullback area? | Assuming every bullish candle confirms continuation |
| Established downtrend | Does the candle show supply returning near a lower high or resistance area? | Assuming one bullish reversal candle ends the trend |
| Range-bound market | Did the candle reject a range boundary or form in the middle? | Treating middle-of-range candles as high-quality signals |
| Possible structural transition | Did the candle support a meaningful break and follow-through? | Calling a trend reversal from a single wick |
Using a market structure indicator as a review aid
A market structure indicator can help organize swing points, possible breaks, and directional conditions on a chart. Its value is not that it replaces analysis, but that it can make a trader’s review process more consistent. The trader can compare the indicator’s displayed structure with the actual candles and decide whether the interpretation makes sense.
When using any TradingView indicator, it is worth understanding what is being displayed and how the settings affect the chart. Some tools may emphasize recent swings, while others may display broader trend information. A line, label, or marker should be treated as chart evidence to examine rather than an instruction that removes the need for judgment.
A practical review sequence
- Start with the broader timeframe. Identify the prevailing directional condition, major swing points, and whether price is trending or ranging.
- Mark the relevant area. Look for a prior high, low, range boundary, or other location where a reaction could be meaningful.
- Review the candlestick response. Examine the body, wicks, close, and relationship to the nearby level.
- Check for structural agreement. Ask whether the candle supports continuation, warns of rejection, or conflicts with the current sequence.
- Compare momentum and trend information. A market structure indicator or related tool may provide additional context, but it should not override what price is showing.
- Define invalidation before acting. Decide what evidence would make the original interpretation less convincing.
This sequence turns candlestick analysis into a process rather than a search for a perfect formation. It also helps beginners understand why experienced traders may notice the same candle but reach different conclusions: they may be assigning different weights to structure, location, timeframe, and risk.

Reviewing broader conditions beyond structure
Market structure is important, but it is not the only context. Trend strength, momentum, volatility, timeframe alignment, and the presence of a consolidation can all affect how a candle should be interpreted. A reversal-looking candle in a strong directional move may only mark a pause. Conversely, a small candle near a major turning area may deserve attention even though its shape is not dramatic.
Trading tools that combine trend analysis, momentum evaluation, market structure, institutional activity, or smart money concepts can help traders bring several observations into one chart review. VP ALGO TRADING develops TradingView indicators and algorithmic trading tools intended to assist with this type of market evaluation. Tools such as the AKMelytics – Market Intelligence Indicator should be used as part of a structured review, not as a substitute for understanding price behavior or managing risk.
Multi-timeframe context
A candle on a lower timeframe can look bullish while price remains inside a bearish structure on a higher timeframe. This is not necessarily a contradiction; it may represent a short-term bounce within a larger decline. Reviewing more than one timeframe can clarify whether the candle is supporting a broad move or only describing a temporary reaction.
The purpose of multi-timeframe analysis is not to find unanimous signals on every chart. Markets rarely look identical across timeframes. Instead, it helps traders identify which observations are broad and which are short-lived.
Common mistakes when interpreting candlestick patterns
Ignoring location
A candle in the middle of an undefined range often provides less useful information than a similar candle at a well-observed boundary. Location gives the pattern a reason to matter.
Confusing a wick with a confirmed reversal
A long wick shows that price moved and then retraced during the candle. It does not confirm that the rejected direction will remain rejected. Follow-through and structural context still matter.
Changing timeframes to find confirmation
Moving between timeframes until a preferred pattern appears can create a biased review. Choose the timeframes in advance and record what each one is intended to show.
Using too many indicators without a clear role
Adding several tools can make a chart appear more informative while making decisions less clear. Each indicator should answer a specific question, such as whether structure is trending, whether momentum agrees, or whether a possible break has developed.
Assuming a tool predicts the next move
An indicator can organize information and highlight conditions, but it cannot eliminate uncertainty. VP ALGO TRADING positions its tools for educational and trading-decision assistance rather than financial advice. No candlestick pattern or indicator removes the possibility of loss.
Building a repeatable candlestick review checklist
A written checklist can reduce impulsive interpretation. It also makes it easier to review past chart decisions without judging them only by their outcome. A trade or analysis can be reasonable even if the market later moves in the opposite direction; the quality of the process should be assessed separately from the result.
- What is the higher-timeframe structure?
- Where did the candlestick pattern form?
- Which price level or swing is relevant?
- What does the candle’s close say about buyer or seller response?
- Does the pattern support continuation, rejection, or uncertainty?
- Do trend and momentum observations agree or conflict?
- What would invalidate the interpretation?
- Am I treating a chart observation as evidence rather than certainty?
Keeping notes on these questions can reveal which patterns are most useful in a trader’s chosen market and timeframe. It can also expose recurring errors, such as entering after an extended move, overlooking range conditions, or giving more weight to a candle than to the surrounding structure.
Final perspective
Candlestick patterns are most useful when they are treated as one layer of evidence. Their shape can describe rejection, commitment, hesitation, or changing pressure, but market structure provides the setting in which that description should be interpreted. Trend, momentum, timeframe, and broader conditions add further context.
A market structure indicator or broader TradingView tool can support a more organized review, particularly when it helps traders compare several chart observations without presenting them as guaranteed outcomes. The practical goal is not to find a pattern that predicts every move. It is to build a clear process for weighing evidence, defining uncertainty, and making trading decisions with appropriate risk awareness.
Frequently asked questions about candlestick patterns
What are candlestick patterns used for?
Candlestick patterns are used to describe price behavior during a specific period. Traders may examine them for signs of rejection, continuation, hesitation, or changing buying and selling pressure, then compare those observations with market context.
Are candlestick patterns reliable on their own?
No pattern should be treated as a guarantee or complete trading signal. Its usefulness depends on factors such as location, market structure, timeframe, trend, momentum, and what price does after the pattern forms.
How does market structure improve candlestick analysis?
Market structure shows whether price is forming higher highs and higher lows, lower highs and lower lows, or moving within a range. This helps traders judge whether a candlestick pattern fits continuation, signals possible rejection, or conflicts with the broader sequence.
What does a market structure indicator do?
A market structure indicator can help display or organize swing points, possible breaks, and directional conditions. Traders should understand how the tool works and compare its output with the underlying price action rather than relying on labels alone.
Should candlestick patterns be reviewed across multiple timeframes?
Reviewing multiple timeframes can show whether a candle represents a broad market move or a short-term reaction. It is helpful to define the role of each timeframe before analysis so that the review does not become a search for convenient confirmation.
Can a TradingView indicator replace candlestick analysis?
No. A TradingView indicator can organize market information and support chart review, but it does not replace understanding price, structure, uncertainty, or risk. Indicators are tools for analysis and decision support, not guarantees of future results.


Recent Comments