
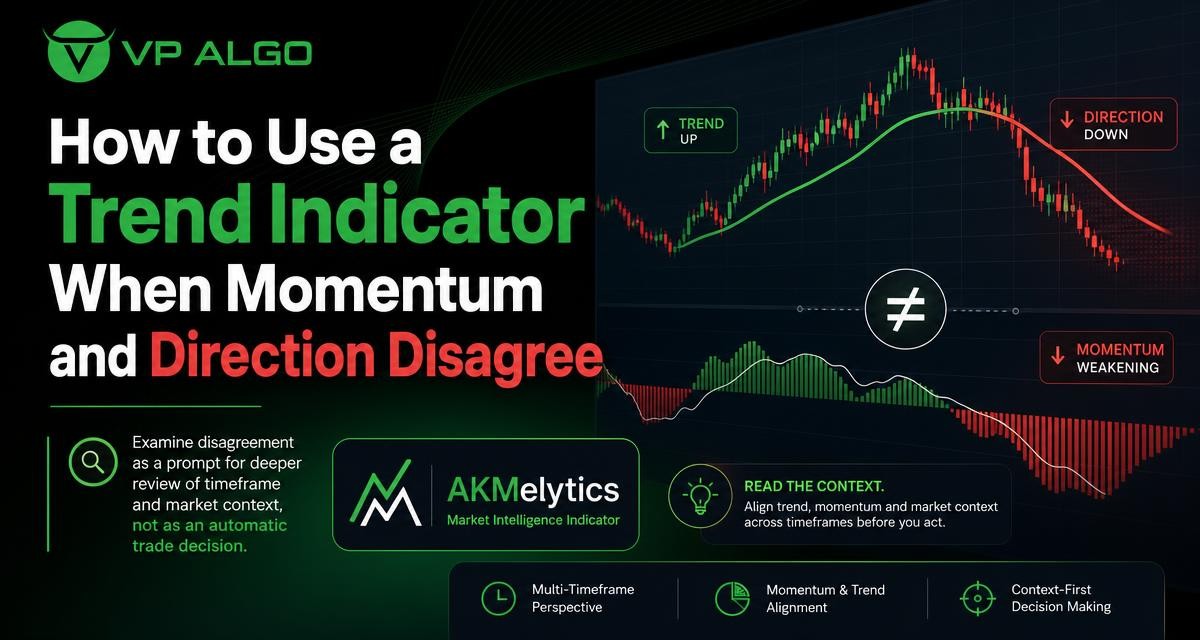
A trend indicator for TradingView can help organise market direction, but it does not always agree with a momentum indicator for TradingView. One tool may show that price remains in an established uptrend while momentum is weakening. In another situation, momentum may turn positive before the broader trend has changed. This disagreement is not automatically a buy or sell signal. It is a prompt to examine timeframe, market structure, volatility, and the quality of the current price move before making a trading decision.
Why trend and momentum can disagree
Trend and momentum describe related but different features of price action. Trend analysis focuses on direction and structure over a chosen period. It may look at whether price is forming higher highs and higher lows, lower highs and lower lows, or moving within a range. Momentum analysis focuses more on the strength and speed of recent price movement. A market can therefore remain structurally bullish while the latest advance loses force.
This difference is normal because indicators process price information in different ways. Trend tools commonly respond more slowly because they are designed to reduce short-term noise. Momentum tools can react earlier to a change in buying or selling pressure, but they may also produce more frequent reversals in a choppy market. Neither reading should be treated as a complete description of market conditions on its own.
| Reading | What it may describe | Useful question |
|---|---|---|
| Trend direction | The broader path of price over the selected timeframe | Is the market still making a consistent sequence of highs and lows? |
| Momentum | The strength or speed of recent movement | Is the latest move gaining force, slowing, or reversing? |
| Market structure | Key swings, breaks, ranges, and reaction areas | Has price actually changed structure, or only pulled back? |
| Context | The relationship between timeframes, volatility, and market conditions | Does the signal make sense within the wider chart? |
What disagreement may be telling you
Trend remains positive but momentum weakens
This is often seen late in an advance or during a normal pullback. Price may still sit above important swing areas, while the momentum reading declines. The disagreement can mean that buyers are losing urgency, but it does not prove that sellers have taken control. A trend may pause, consolidate, or continue after momentum has temporarily cooled.
Review the most recent price structure rather than reacting to the momentum reading alone. If higher lows remain intact and price is holding a significant area, the momentum change may simply reflect a correction. If price begins breaking successive support areas, the same weakening momentum deserves more attention because it is now appearing alongside structural deterioration.
Trend remains negative but momentum improves
A rising momentum reading during a downtrend can occur during a short-term rebound, a deeper correction, or the early stage of a possible reversal. The important question is whether the market has produced evidence of a directional change. A positive momentum reading by itself does not establish a new uptrend.
Look for changes in swing behaviour, the way price reacts at resistance, and whether the rebound can hold its gains. A market that produces a brief rally but remains below important lower highs is different from one that breaks and retests a meaningful structural level. The indicator can draw attention to the change in pressure, while price structure helps place that change in context.
Both readings change frequently
Frequent shifts between positive and negative readings often occur when price is ranging or when the selected timeframe is too short for the question being asked. In these conditions, a trend indicator and momentum indicator may both respond to small movements that have little significance in the broader chart.
Rather than searching for a new signal after every change, identify whether the market has a clear directional structure. If it does not, it may be more useful to wait for a clearer break, reduce the importance given to short-term readings, or treat the chart as a range until new evidence appears.
A practical review process on TradingView
1. Define the timeframe before interpreting the signal
Every indicator reading belongs to a timeframe. A bullish trend reading on a four-hour chart can coexist with bearish momentum on a fifteen-minute chart without creating a genuine contradiction. The two tools may simply be describing different parts of the same market movement.
Start by deciding what the chart is intended to explain. If you are studying the broader market direction, begin with a higher timeframe and use lower timeframes only to examine detail. If you are reviewing a short-term setup, still check whether the move is occurring against a larger trend. This does not dictate an outcome, but it helps prevent a short-term reading from being mistaken for a complete market reversal.
2. Separate direction from timing
A trend indicator is generally more useful for asking, “Which way has the market been moving?” A momentum indicator is often more useful for asking, “How strong is the latest movement?” These are not the same question. A trend reading can provide directional context while momentum helps identify whether the current move is accelerating, pausing, or losing energy.
When the readings disagree, avoid forcing one tool to answer both questions. Instead, record them separately. For example, the trend may be bullish, momentum may be declining, and price may be approaching a prior reaction area. That description is more informative than labelling the chart simply bullish or bearish.
3. Inspect market structure
Market structure gives the disagreement a price-based reference. Mark recent swing highs and lows, notable breaks, consolidation zones, and areas where price previously reacted. Then ask whether the current movement has changed those features.
A weakening momentum reading inside an intact sequence of higher lows may describe a pullback. A similar momentum reading after a decisive break below a key swing low may describe a more serious change in conditions. The indicator has not changed its meaning by itself; the surrounding structure has changed the interpretation.
4. Check for multi-timeframe agreement
Multi-timeframe trend assessment can help distinguish a local counter-move from a broader shift. Compare the higher-timeframe trend with the intermediate and lower-timeframe readings, but do not expect every timeframe to align at all times. Markets often rotate between advances, pullbacks, and consolidations.
A useful review asks whether the lower-timeframe momentum change supports the higher-timeframe direction, temporarily opposes it, or reflects a separate range. This approach is more measured than treating alignment across every chart as a requirement or treating disagreement across every chart as a warning.
5. Consider volatility and market conditions
Indicators can behave differently when price is moving steadily, breaking from a range, or fluctuating without a clear direction. A momentum tool may reverse repeatedly in a narrow range. During a fast move, it may remain extended while price continues to trend. These behaviours are not necessarily errors; they reflect the conditions being measured.
Review the size and consistency of recent candles, the distance between swing points, and whether price is expanding or contracting. The same indicator setting may produce different-looking readings in quiet and fast-moving conditions. Market context should therefore be part of the review rather than an afterthought.
Using a TradingView indicator without over-relying on it
A TradingView indicator can make chart review more structured by presenting several observations in one workspace. The Delphi Intelligence Smart Money Indicator offered by VP ALGO TRADING includes features related to trend analysis, momentum signals, market structure, institutional flow monitoring, multi-timeframe trend assessment, and smart money analysis. These features are intended to support the evaluation of market conditions and potential setups, not to replace a trader’s own review.
When using a combined tool, examine what each component is contributing. A trend display may summarise directional conditions, while momentum and structure features may provide different evidence about the current move. Treating every visual element as an independent confirmation can create a false sense of agreement. A better approach is to understand whether the readings are measuring separate aspects of price or repeating the same underlying information.
Use the indicator as a checklist
- What is the primary trend on the selected timeframe?
- Is momentum supporting that direction, weakening, or moving against it?
- Has market structure changed, or is price still within the previous range?
- What does a higher timeframe show?
- Is the current movement occurring in a clean trend, a pullback, or a consolidation?
- What evidence would invalidate the current interpretation?
This checklist encourages a complete chart review. It also makes it easier to identify uncertainty. If the answers point in different directions, the appropriate conclusion may be that conditions are unclear rather than that a trade decision must be made immediately.
Common mistakes when trend and momentum conflict
Assuming momentum reversal equals trend reversal
Momentum can change before market structure changes. That early change may be useful information, but it is not confirmation by itself. A trader who treats every momentum reversal as a trend reversal may react to ordinary pullbacks and short-term fluctuations.
Ignoring the chart timeframe
A signal without a timeframe is incomplete. A bearish momentum reading on a lower timeframe may be consistent with a bullish higher-timeframe pullback. Always identify the chart period and compare it with the period used for the broader directional view.
Adding more indicators to remove uncertainty
When two readings disagree, adding multiple similar indicators may produce more labels without producing better understanding. Several tools can respond to the same price data and appear to confirm one another. It is usually more useful to clarify the role of each tool and return to price structure than to keep adding signals.
Using fixed interpretations in every market condition
A trend reading has a different practical meaning in a clean directional move than in a sideways market. Momentum weakness during a strong trend may be a pause, while the same weakness after repeated failed highs may signal a more meaningful loss of demand. Interpretation should adapt to the condition visible on the chart.
Turning analysis into a guaranteed outcome
No trend indicator or momentum indicator can remove uncertainty from financial markets. Indicator readings can help organise observations, but they do not guarantee a result or eliminate losses. Consider position sizing, risk limits, and the possibility that the market will behave differently from the current interpretation.
How to document disagreement before making a decision
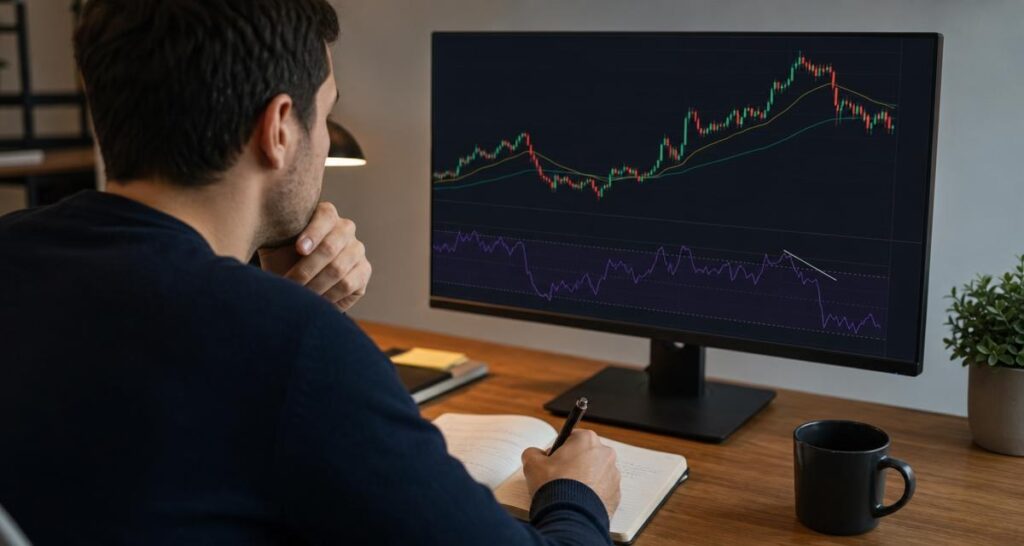
Writing down the conflicting readings can reduce impulsive interpretation. Note the timeframe, current trend, momentum direction, nearby structure, and the condition that would change your view. This creates a record of the reasoning rather than just the final outcome.
- State the trend direction and the evidence supporting it.
- Describe what momentum is doing now.
- Identify the latest meaningful swing high and swing low.
- Explain whether price is trending, pulling back, breaking out, or ranging.
- Compare the reading with at least one broader timeframe.
- Write down what would confirm or weaken the current interpretation.
This process can be used with a standalone trend indicator for TradingView or with a broader market intelligence tool. Its purpose is not to create certainty. It is to make the reasoning visible and consistent enough to review later.
When a combined market intelligence indicator may help
Some traders prefer to review trend, momentum, structure, institutional activity, and smart money concepts within one TradingView workspace. A combined indicator may help organise that review, particularly when the main challenge is switching between separate chart tools and losing the relationship between their readings.
However, consolidation does not remove the need for interpretation. Traders still need to understand the timeframe, assess the underlying price action, and decide how much weight to give each feature. VP ALGO TRADING positions its indicators as tools for educational and trading-decision assistance rather than financial advice. Any use of an indicator should therefore remain part of an individual process for analysis and risk management.
Final perspective
When a trend indicator and momentum indicator disagree, the most useful response is usually a deeper review rather than an automatic trade decision. Identify the timeframe, separate direction from strength, inspect market structure, and consider whether the market is trending or ranging. Then compare the picture across timeframes and document what would change your interpretation.
A trend indicator for TradingView can provide valuable organisation to this process, especially when paired with momentum and market structure analysis. Its role is to help you evaluate conditions more systematically. The final interpretation still depends on context, discipline, and an honest recognition that indicator readings cannot predict or guarantee future market behaviour.
Frequently Asked Questions
What does it mean when a trend indicator and momentum indicator disagree?
It means the broader directional reading and the strength of the latest price movement are showing different conditions. The market may be pulling back, consolidating, or beginning to change direction. The disagreement requires context rather than an automatic trade response.
Is weakening momentum proof that a trend will reverse?
No. Momentum can weaken during a normal pullback while the existing trend structure remains intact. Look for supporting evidence in swing highs, swing lows, support or resistance areas, and higher-timeframe behaviour.
How should I compare timeframes on TradingView?
Start with the timeframe that represents the broader market question, then review lower timeframes for detail. A lower-timeframe move against the higher-timeframe direction may be a temporary counter-move rather than a complete reversal.
Can a momentum indicator lead a trend indicator?
It can change earlier because momentum responds to recent price movement, while trend measures may be slower. An earlier momentum change can highlight a developing shift, but it still needs confirmation from price structure and wider market context.
Should I add more indicators when readings conflict?
Not necessarily. Adding several tools that process similar price information can create more noise. First clarify what each existing indicator measures and return to price structure, timeframe, and volatility.
Can the Delphi Intelligence Smart Money Indicator resolve conflicting signals?
The indicator is designed to help traders evaluate areas such as trend, momentum, market structure, institutional activity, multi-timeframe conditions, and smart money analysis. It can organise information, but it cannot remove uncertainty or guarantee a trading outcome.


Recent Comments