

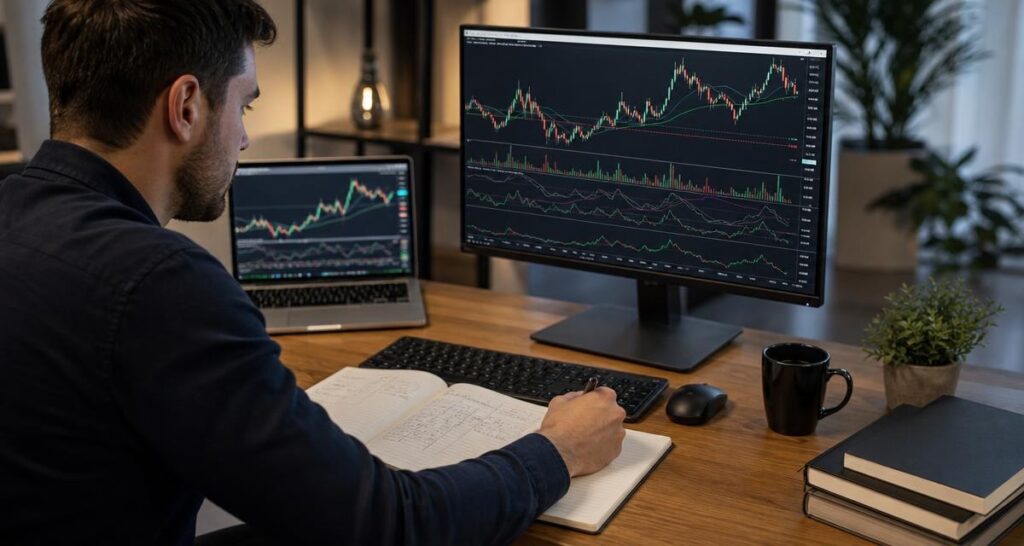
A trading technical analysis journal is more than a list of entries and exits. It is a repeatable record of what you saw, what you expected, how your plan developed and whether your actions followed that plan. By recording trend, momentum, market structure and smart money observations in the same format, you can review your decision-making instead of relying on isolated chart readings or memory.
Why a technical analysis journal improves chart reviews
Charts can look obvious after a move has already happened. Before the move, however, traders are working with incomplete information. A journal preserves the conditions that existed when a decision was made. That makes it easier to distinguish a reasonable process from a fortunate result, or an avoidable mistake from an outcome caused by normal market uncertainty.
Consistent notes can also expose habits that are difficult to notice during a live session. You may discover that you take setups against the higher-timeframe trend, enter when momentum is weakening, treat every structure break as equally meaningful, or change your interpretation after price moves. These observations can guide improvements to your trading strategies without requiring a completely new method.
Review the process, not just the result
A profitable trade can still follow a weak process, while a losing trade can follow a carefully prepared plan. The result matters, but it should not be the only measure used in a review. Record the reasoning behind the trade, the evidence supporting it, the conditions that would invalidate it and the way you managed the position.
This approach keeps a journal focused on decisions that can be repeated. It also reduces the temptation to judge every chart using hindsight. A useful review asks, “Was this decision consistent with my rules and available evidence?” rather than only asking, “Did price move in my direction?”
The four observation groups to record
A practical journal does not need to capture every visible detail on a chart. It should focus on the information that influences your interpretation. Four useful groups are trend, momentum, market structure and smart money or institutional activity. These groups can be recorded separately before being combined into an overall market view.
| Observation group | Questions to record | Possible journal entry |
|---|---|---|
| Trend | What is the directional bias on the selected timeframes? | Higher timeframe bullish; shorter timeframe consolidating. |
| Momentum | Is movement strengthening, weakening or conflicted? | Upside momentum present, but recent candles show less follow-through. |
| Market structure | Which swings, breaks or ranges define the current context? | Price remains inside a range after a failed break above resistance. |
| Smart money observations | Are there signs of notable participation, imbalance or liquidity interaction? | Record the observed zone or event without assuming who caused it. |
How to record trend analysis
Begin with direction and timeframe. Write whether the market is trending upward, trending downward, ranging or unclear. Then record the evidence supporting that description, such as a sequence of higher highs and higher lows, lower highs and lower lows, or repeated reactions between established boundaries.
It is useful to separate the broader context from the execution timeframe. A market may have an upward structure on a higher timeframe while making a short-term decline. Recording both prevents a temporary pullback from being mistaken for a complete change in direction. It also helps you explain why a setup was considered a continuation, a reversal attempt or simply a range trade.
Use a neutral trend vocabulary
Words such as “bullish” and “bearish” can become too broad on their own. Add a short explanation to each label. For example, write “higher-timeframe upward structure, short-term retracement” or “lower-timeframe strength inside a wider range.” This creates a more precise record and makes later reviews easier.
If timeframes disagree, record the disagreement rather than forcing a single directional opinion. Conflicting signals are information. They may indicate a transition, consolidation or a market that does not fit the conditions your plan is designed to trade.
How to record momentum
Momentum describes the strength and persistence of a move, but it should not be treated as a simple guarantee that price will continue. In your journal, note whether momentum is increasing, fading or alternating. Look at the size and consistency of price movements, the speed of the move and whether follow-through appears after important levels are tested.
Momentum is often most useful when compared with structure. Strong movement into a confirmed breakout may support a continuation idea, while a weak push that cannot hold beyond a key level may suggest caution. Neither observation decides the trade by itself. The journal should show how momentum was weighed alongside trend, location and invalidation conditions.
Record momentum changes, not just momentum labels
Instead of writing only “strong momentum,” describe what changed. You might note that candles expanded after a range break, that follow-through weakened near a prior swing, or that price moved quickly but failed to hold the new area. Specific observations are easier to test across multiple journal entries.
Also record when momentum is mixed. A market can show a strong directional move while producing signs of short-term exhaustion. Writing down both sides of the observation helps prevent one attractive signal from dominating the whole analysis.
How to document market structure
Market structure gives your chart review a framework. Mark the relevant swing points, ranges, support and resistance areas, and any break or rejection that changed your interpretation. Explain whether the event was confirmed by a close, quickly reversed or still needed more evidence according to your own rules.
Structure should be described in context. A break inside a narrow range may not carry the same meaning as a break from a well-established range. Likewise, a move beyond a previous high does not automatically prove that a new trend has begun. Your journal should record what happened and how much confidence you assigned to it, without turning a single event into a certainty.
Separate observation from interpretation
A strong journal distinguishes facts visible on the chart from conclusions drawn from those facts. “Price moved above the prior swing high and closed back inside the range” is an observation. “The breakout failed” is an interpretation. Both are useful, but separating them makes your reasoning easier to audit.
This distinction is particularly helpful when reviewing losing trades. It allows you to ask whether the chart evidence was misunderstood, whether the interpretation was reasonable but the outcome was uncertain, or whether your entry ignored information already present on the chart.
How to record smart money observations carefully
Smart money concepts often lead traders to study liquidity, imbalances, institutional activity and areas where price may react. These observations can be included in a journal, but they should be written as chart-based hypotheses rather than confirmed knowledge about the actions of specific institutions.
Record the location, the price behavior and the reason the area matters to your plan. For example, note that price reacted strongly after interacting with a previously identified zone, or that a move appeared to collect liquidity before reversing. Avoid presenting an interpretation as a fact when the chart does not independently verify who participated or why.
A useful smart money journal format
- Location: Identify the relevant zone, swing, range boundary or imbalance.
- Observed behavior: Describe the reaction, rejection, continuation or failure.
- Context: State how the observation relates to trend and market structure.
- Trade relevance: Explain whether it supports, weakens or does not affect the setup.
- Invalidation: Record what price behavior would make the interpretation less relevant.
This format keeps smart money analysis connected to a broader review process. It also prevents a visually attractive zone from becoming a reason to trade without considering momentum, structure or risk.
A repeatable indicator-based journal workflow
Indicators can help organize information, but they do not remove the need for interpretation. A TradingView indicator or other charting tool may present trend, momentum, structure or smart money-related observations in a consistent way. Your journal should record what the tool showed, how it compared with the chart and whether it matched your trading rules.
- Set the context: Record the instrument or chart being reviewed, the timeframe and the session or review period.
- Describe the broader trend: Note the directional structure and whether shorter-term movement agrees with it.
- Assess momentum: Write whether movement is expanding, fading, mixed or unclear.
- Mark structure: Record important swings, ranges, breaks, retests and failed moves.
- Review smart money observations: Document relevant zones or activity as observations and hypotheses.
- State the setup condition: Explain what would need to happen before a trade idea becomes valid.
- State invalidation: Record the price behavior or change in context that would cancel the idea.
- Complete the review: After the move, compare the original notes with what actually occurred.
Following the same order reduces the chance that one late signal will dominate your analysis. It also creates comparable records, which are much more useful than free-form notes that change from one chart to the next.
What to include in each journal entry
A journal can be digital, spreadsheet-based or handwritten. The format matters less than the consistency of the fields. Keep the core record concise enough to complete during a normal review, while leaving room for a post-trade reflection.
| Journal field | Purpose |
|---|---|
| Date and chart context | Shows when and under what conditions the analysis was made. |
| Trend assessment | Records direction across the relevant timeframes. |
| Momentum assessment | Captures strength, weakness and changes in follow-through. |
| Structure notes | Identifies ranges, swings, breaks and invalidated ideas. |
| Smart money observations | Documents zones, liquidity behavior or participation hypotheses. |
| Plan and invalidation | Defines what supports the idea and what would cancel it. |
| Post-review notes | Compares the original reasoning with the later price action. |
If you use an indicator, add a field for its displayed conditions and another for your own interpretation. This helps you learn whether you are following the tool mechanically or using it as one input in a broader decision process.
Common journaling mistakes to avoid
Recording only trades that were taken
Logging only executed trades creates a distorted sample. Record relevant setups that you considered but did not take, especially when your reason for standing aside was clear. This can reveal whether your selectivity is consistent or whether fear and hesitation are changing your decisions.
Changing the explanation after the move
Post-event analysis is valuable, but it should be based on the original note. Keep the initial observation separate from the later explanation. If your view changed, record when and why it changed rather than rewriting the earlier entry.
Using too many fields
A journal that takes too long to complete is unlikely to remain consistent. Start with the fields that directly affect your trading process. Add detail only when it answers a recurring question or helps you evaluate a specific part of your method.
Treating an indicator as a decision-maker
An indicator can organize signals and observations, but it does not know your full context, risk limits or personal rules. Use tools such as AKMelytics – Market Intelligence Indicator as part of a structured review process, and document how its information fits with your own analysis rather than assuming any displayed signal guarantees an outcome.
How to review a month of journal entries
Set aside a regular review period and group entries by the issue you want to understand. You might compare trades taken with the trend against trades taken during conflicting conditions, or examine whether momentum observations were recorded consistently. The goal is not to find a perfect pattern after a small number of examples, but to identify repeated behaviors worth investigating.
- Which market contexts produced the clearest analysis?
- When did trend and structure agree, and when did they conflict?
- Did momentum notes describe changes or rely on vague labels?
- Were smart money observations connected to location and context?
- Did entries follow the documented conditions and invalidation rules?
- Which mistakes occurred more than once?
Use the answers to refine your process one change at a time. For example, you may decide to require a clearer structure description, separate higher- and lower-timeframe notes, or stop taking setups when the evidence is too conflicted for your stated plan.
Final thoughts
Trading technical analysis becomes more useful when it is treated as a process that can be documented and reviewed. A journal connecting trend, momentum, market structure and smart money observations gives you a clearer record of how a trading idea was formed. It also helps you use indicators more thoughtfully: as tools for organizing market information, not as substitutes for judgment or risk awareness.
Whether you review charts manually or use a TradingView indicator such as AKMelytics, keep the record specific, consistent and honest about uncertainty. The purpose of the journal is not to prove that every decision was correct. It is to make your decision-making visible enough to improve.
Frequently asked questions
What should a trading technical analysis journal include?
Include the chart context, timeframe, trend, momentum, market structure, smart money observations, setup conditions, invalidation point and post-review notes. Keep the fields consistent so entries can be compared.
How often should I review my trading journal?
Review entries regularly, such as after a group of related setups or at a planned weekly or monthly review. A consistent schedule is more useful than reviewing only after an unusually good or bad result.
Should I journal trades that I did not take?
Yes. Recording considered but rejected setups helps you evaluate whether your decisions to wait, avoid or change direction were based on your rules rather than emotion or hindsight.
How do indicators fit into a technical analysis journal?
Record what the indicator displayed and then explain how that information agreed or conflicted with your independent reading of trend, momentum and structure. This shows whether the tool is supporting a process or replacing it.
Can smart money concepts be recorded objectively?
You can record the observable price behavior, location and reaction objectively. Interpretations about institutional activity should remain hypotheses rather than claims of confirmed knowledge about who caused a move.
Does journaling guarantee better trading results?
No. Journaling cannot guarantee profits or remove market uncertainty. Its purpose is to make your process easier to review so you can identify repeated strengths, weaknesses and rule-breaking behavior.


Recent Comments