
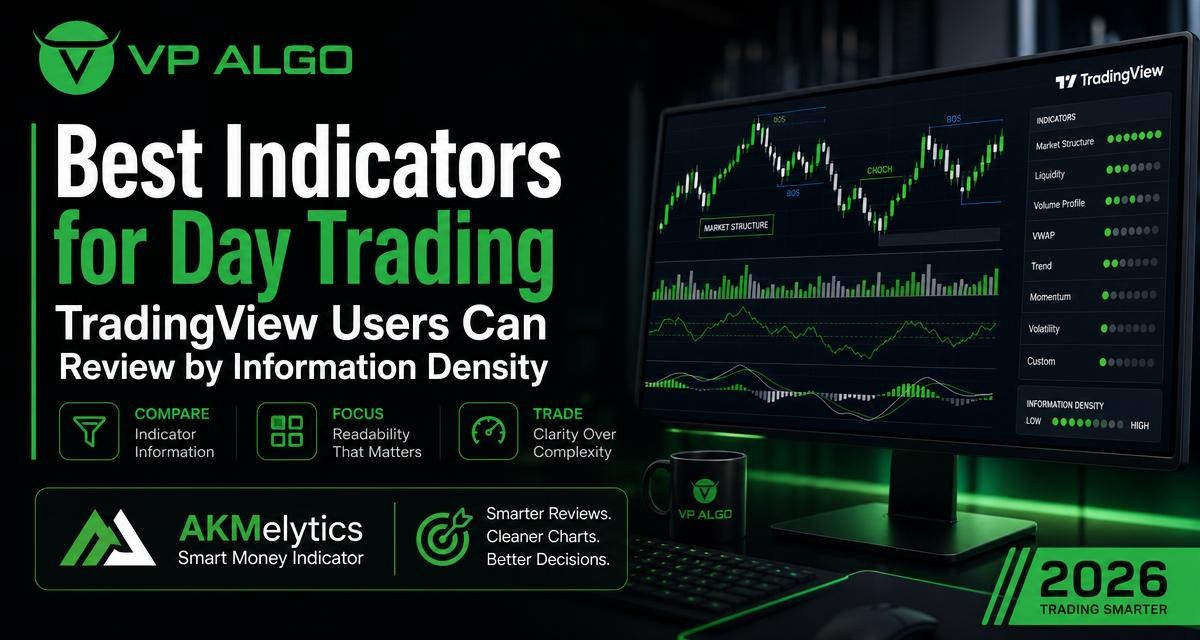
Searching for the best indicators for day trading TradingView users can apply often leads to long lists of tools. A more useful question is how much relevant information an indicator presents, how clearly it presents it, and whether the chart remains readable during a fast-paced review. By comparing information density rather than counting features, traders can assess trend, momentum, market structure and smart money context without turning every chart into a crowded collection of signals.
What information density means in day trading
Information density describes the amount of decision-relevant context an indicator provides in a usable space. It is not simply the number of lines, labels or panels on a TradingView chart. A chart can contain many visual elements while offering little help with the questions a trader is actually asking.
For a day-trading review, those questions may include: What is the current directional bias? Is momentum supporting the move? Has market structure changed? Is there evidence of unusual market flow? Does a higher timeframe agree with the chart being reviewed? An indicator with useful information density helps organise these questions into a readable process.
High density is not the same as maximum complexity
A high-information tool should reduce unnecessary switching between indicators and timeframes. It should not force a trader to interpret so many colours, alerts and markers that the original price action becomes difficult to see. The goal is structured context, not visual overload.
| Review area | Useful information | Common readability problem |
|---|---|---|
| Trend | Directional bias and changes in trend conditions | Too many moving lines or conflicting signals |
| Momentum | Whether price movement has supporting strength | Using a momentum reading as a standalone entry rule |
| Market structure | Breaks of structure and possible character changes | Labels that obscure candles or appear too frequently |
| Market flow | Context related to institutional activity or flow | Interpreting contextual data as a guaranteed prediction |
| Multi-timeframe context | Relationship between broader and shorter-term conditions | Mixing timeframes without a defined review sequence |
| Risk reference | Volatility-based levels for planning and comparison | Treating reference levels as certain outcomes |
How to compare the best indicators for day trading on TradingView
Instead of asking which indicator is universally best, compare each tool against the job it needs to perform. A simple trend indicator may be appropriate when the main requirement is directional filtering. A momentum indicator may add useful confirmation, but it may not explain why a move is occurring. A market structure indicator can provide a different type of context by marking events such as breaks of structure or changes in character.
The strongest comparison considers whether the information is distinct, readable and relevant to the intended review. If three indicators repeat the same price information in slightly different formats, the chart may become more complicated without becoming more informative.
1. Trend information
A trend tool can help traders organise the chart around directional conditions. When reviewing a potential setup, the useful question is not merely whether an indicator displays an upward or downward signal. It is whether the signal is easy to interpret, whether it can be checked against price action, and whether it fits the timeframe being reviewed.
Trend information is usually most useful as context. It can help a trader decide whether to investigate continuation ideas, possible reversals or a market that lacks a clear directional condition. It does not remove the need to assess volatility, timing or risk.
2. Momentum information
A momentum indicator for TradingView can help evaluate the strength or persistence of a price move. Momentum may support a trend assessment, show weakening participation or highlight a condition worth examining more closely. Its role is different from that of a market structure indicator, even when both appear on the same chart.
Readability matters because momentum readings can change quickly. A tool that displays a simple, understandable condition may be more practical during a rapid review than one that adds numerous overlapping signals. Momentum should be treated as one part of a process rather than an automatic buy or sell instruction.
3. Market structure information
A market structure indicator can add a price-action framework to the chart. Break of Structure, often abbreviated as BOS, and Change of Character, or CHoCH, are examples of structure events that can help traders describe how price is behaving. These labels are useful only when the trader understands what they represent and can relate them to the broader market context.
Structure labels should remain visually manageable. If every minor fluctuation creates a marker, the chart may become difficult to review. A good comparison therefore asks how the tool distinguishes meaningful structure events from routine movement and whether the display can be configured to match the trader’s preferred level of detail.
4. Institutional activity and smart money context
A smart money indicator for TradingView may bring together information associated with market flow, institutional activity and smart money concepts. This can broaden the review beyond a single trend or momentum reading. However, terms such as institutional activity should be treated as analytical context, not proof that a particular participant will cause the next price movement.
The most useful display explains how the information fits into the rest of the chart. For example, a trader may compare a flow-related condition with market structure and momentum rather than treating the flow reading as an isolated signal. The aim is to improve the quality of the review, not to create certainty where the market remains uncertain.
5. Multi-timeframe information
Day traders frequently need to distinguish broader conditions from shorter-term movement. A multi-timeframe view can help organise that distinction by showing how the current chart relates to other selected timeframes. This can reduce the need to switch back and forth between separate charts, provided the information is presented clearly.
Multi-timeframe context is most useful when the review sequence is defined in advance. A trader might first consider the broader trend, then examine structure and momentum on the working chart, and finally review the potential setup. The indicator should support that sequence rather than encourage constant changes of timeframe in response to every new candle.
Why dashboards can improve chart reviews
A dashboard can increase information density by placing several conditions in one visible area. Instead of searching across multiple panels, a trader may be able to review trend, momentum, structure or timeframe context in a single summary. This is particularly relevant when the objective is to scan a chart consistently rather than inspect one signal in isolation.
Dashboard design is as important as the information it contains. Clear labels, consistent colours and sensible grouping help the user understand what is being shown. A crowded dashboard with ambiguous abbreviations may have high data density but low practical value.
A practical dashboard review
- Start with the overall trend condition.
- Check whether momentum supports or conflicts with that condition.
- Review recent structure events rather than every historical label.
- Consider any flow or smart money context as supporting information.
- Compare the working timeframe with the broader timeframe view.
- Use risk and target references for planning, not as guarantees.
Where an all-in-one TradingView indicator may fit
AKMelytics – Smart Money Indicator is a TradingView technical analysis tool designed to combine several review areas in one indicator. Its described features include momentum, trend analysis, market structure, market flow, relative strength and smart money concepts. It also includes multi-timeframe analysis, BOS and CHoCH structure events, Fibonacci projections, volatility-based target and risk reference levels, dashboard context and configurable TradingView alerts.
That feature set makes it relevant to a comparison based on information density. Rather than requiring a separate tool for every analytical category, a trader can examine how these areas are presented together. The important question remains whether the display suits the user’s process. A broad feature set is useful only when the trader can understand the conditions and apply them consistently.
Questions to ask when reviewing AKMelytics
- Can the dashboard be read quickly without hiding important price action?
- Are trend, momentum and structure shown as distinct categories?
- Can the trader identify which timeframe each condition represents?
- Are alerts configurable to support a chosen review process?
- Do Fibonacci and volatility-based levels serve as references rather than automatic trade instructions?
- Can the amount of information be adjusted to avoid unnecessary chart clutter?
These questions help keep the comparison practical. They also prevent a common mistake: assuming that more features automatically produce better decisions. An indicator is a decision-support tool, not a substitute for a trading plan, risk assessment or independent analysis.
Comparing single-purpose tools with combined indicators
Single-purpose tools can be easier to learn. A trader who only wants to monitor momentum may prefer a focused display with few distractions. Likewise, someone studying market structure may value a specialised view of BOS and CHoCH events without additional dashboard elements.
Combined indicators can be useful when the trader wants a more organised overview. They may reduce the need to maintain several separate scripts, but they also require more time to configure and understand. The best choice depends on the user’s experience, review speed and tolerance for visual complexity.
| Tool approach | Potential advantage | Point to test | Suitable review question |
|---|---|---|---|
| Trend-focused indicator | Simple directional overview | Can it handle changing conditions clearly? | What is the current directional bias? |
| Momentum-focused indicator | Focused view of movement strength | Does it add context beyond price direction? | Is momentum supporting the move? |
| Market structure indicator | Organises BOS and CHoCH events | Are labels selective and readable? | Has the structure materially changed? |
| Combined smart money indicator | Several analytical categories in one view | Can the dashboard remain understandable? | How do trend, flow, structure and momentum relate? |
How to avoid information overload on TradingView
Information overload often begins when traders add tools without assigning each one a specific purpose. Five indicators may all be answering a similar trend question, while no tool is helping with structure or timeframe context. The result is not necessarily better analysis; it may simply be more visual noise.
Before adding an indicator, write down the question it is intended to answer. If another tool already answers that question clearly, consider whether the new tool adds a genuinely different perspective. This small discipline can keep a day-trading workspace focused.
Use a review hierarchy
- Market condition: Decide whether the chart appears directional, transitional or unclear.
- Broader context: Review the higher-timeframe trend or other available context.
- Structure: Examine recent BOS, CHoCH or other relevant price-action events.
- Momentum and flow: Look for supporting or conflicting information.
- Planning: Consider volatility-based references and define what would invalidate the idea.
- Execution discipline: Follow the trader’s own rules rather than reacting to every alert.
This hierarchy is not a trading signal or a guaranteed strategy. It is a way to arrange information so that the chart can be reviewed in a repeatable order. Traders should test any indicator in a suitable environment and decide how it fits their own approach.
Alerts, projections and reference levels
Configurable TradingView alerts can help draw attention to conditions that a trader has chosen to monitor. Alerts are most useful when their purpose is clear. An alert can prompt a review, but it does not establish that a trade is appropriate or that a predicted movement will occur.
Fibonacci projections and volatility-based target or risk reference levels can also add planning context. They should be interpreted as analytical references. They are not guarantees, fixed outcomes or replacements for position sizing and risk management decisions.
How to choose the right information density for your workflow
Start with the speed and depth of your normal chart review. If you scan several markets quickly, a concise dashboard may be more practical than a chart filled with historical labels. If you study a smaller number of setups in detail, additional structure and flow information may be worthwhile.
Then review the indicator over different market conditions. A display that looks clear during a strong trend may become confusing during consolidation or a rapid change in direction. Look for consistency in the way information is labelled and ask whether you can explain each element without guessing.
VP ALGO TRADING develops and sells TradingView indicators and algorithmic trading tools. The company offers a request-based 7-day free trial for its indicator and Telegram channel, while product access after purchase involves providing a TradingView ID by email. Support is available for installation, activation or usage assistance. Availability and terms should be confirmed directly with the company before proceeding.
Final perspective
The best indicators for day trading TradingView users can review are not defined by the largest number of signals. They are tools that present relevant information in a form the trader can understand and apply consistently. Trend, momentum, market structure, market flow and multi-timeframe context can each contribute something different, but only when their roles remain clear.
When comparing a focused tool with a combined indicator such as AKMelytics – Smart Money Indicator, assess the quality of the review experience: readable dashboards, useful distinctions between conditions, configurable displays and sensible reference levels. Use the indicator to support analysis and decision-making, never as financial advice or a promise of results.
Frequently asked questions
What are the best indicators for day trading on TradingView?
There is no single best indicator for every trader. A useful choice depends on whether the main need is trend, momentum, market structure, flow context, multi-timeframe analysis or a combination of these areas.
What does a market structure indicator show?
A market structure indicator can organise price-action events such as Break of Structure and Change of Character. The usefulness of those labels depends on their clarity and how they are interpreted alongside broader market context.
Is a smart money indicator the same as a buy and sell indicator?
Not necessarily. A smart money indicator may provide context related to structure, flow and smart money concepts, but that information should not be treated as a guaranteed buy or sell instruction.
Can one TradingView indicator replace several separate tools?
A combined indicator may bring several analytical categories into one display, which can simplify a review. It still needs to be understood and configured properly, and some traders may prefer focused tools for specific tasks.
How can traders avoid an overcrowded TradingView chart?
Assign each indicator a specific question, remove duplicated information and use a clear review order. Dashboards and configurable displays can also help, provided they remain readable and do not cover important price action.
Do TradingView indicator alerts guarantee a trading opportunity?
No. An alert only identifies a condition selected by the user or indicator. It should prompt further analysis rather than be treated as financial advice, a guaranteed opportunity or a promise of profit.


Recent Comments