
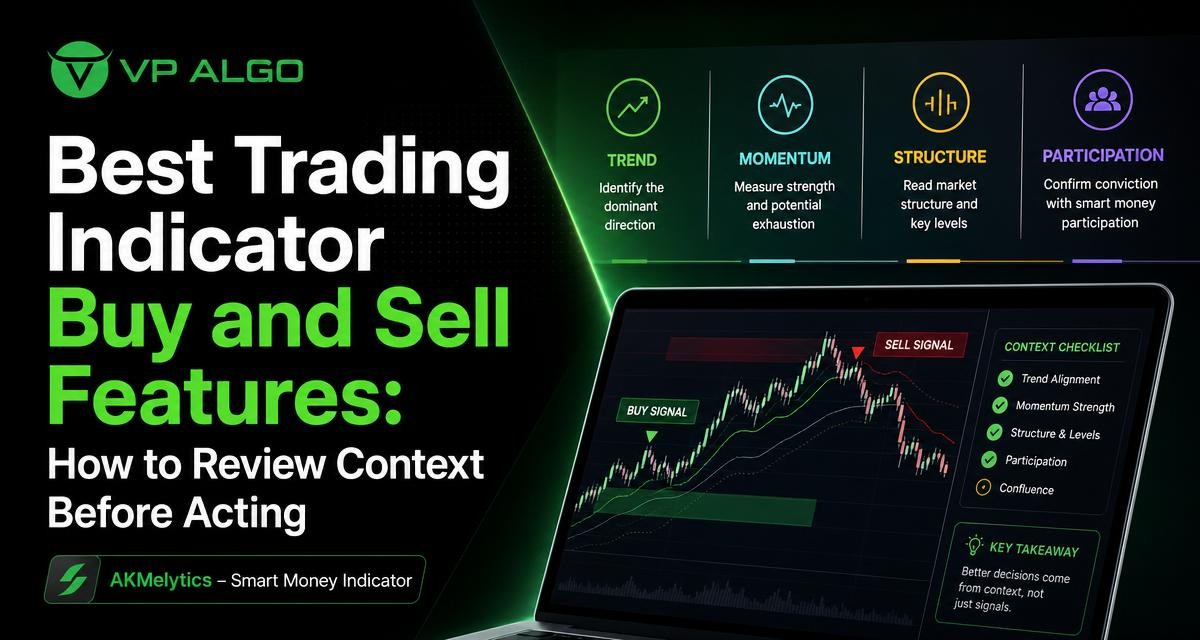
Finding the best trading indicator buy and sell features is not only a matter of choosing the tool with the most visible signals. A buy or sell indication becomes more useful when it is reviewed alongside the broader market context, including trend direction, momentum, market structure, participation and the timeframe being analysed. The AKMelytics – Smart Money Indicator from VP ALGO TRADING is designed to bring several of these analytical areas together in TradingView, helping traders examine potential setups with a more structured process rather than reacting to one signal in isolation.
Why buy-and-sell indications need context
A chart marker can attract attention, but it does not explain the complete condition behind a potential setup. Price may show a bullish indication while the broader trend remains weak, or a bearish indication may appear during a temporary pullback inside a larger upward structure. Without additional context, the same visual signal can be interpreted in very different ways.
Context does not turn an indicator into a prediction tool. It gives the trader more information to review before deciding whether a setup deserves further analysis. This distinction matters because technical indicators support decision-making; they do not provide financial advice or remove the possibility of losses.
Separate signal generation from decision-making
One useful habit is to treat an indication as the beginning of a review, not the end of one. A buy indication can prompt questions about trend, momentum, structure and participation. A sell indication can lead to the same review from the opposite direction.
- What is the dominant direction on the selected timeframe?
- Is current momentum supporting or conflicting with the indication?
- Has market structure changed, or is price simply moving within an established range?
- Does the broader context support continued movement or suggest caution?
- Are other timeframes broadly aligned, or do they tell a different story?
Four context areas to review before acting
A practical review can be organised around four connected areas: trend, momentum, market structure and participation. Looking at them separately can make a chart feel fragmented. Looking at them together can help traders understand why an indication has appeared and whether it fits the conditions visible on the chart.
1. Trend direction
Trend analysis addresses the general direction of price movement. It can help distinguish a potential continuation setup from a possible reversal or countertrend move. On a chart, this may involve reviewing whether price is generally forming higher highs and higher lows, lower highs and lower lows, or a less directional range.
A trend indicator for TradingView can be useful as a visual reference, but it should be interpreted in relation to the selected timeframe. A short-term bullish move may occur inside a wider bearish trend. Similarly, a short-term decline does not automatically invalidate a larger upward structure.
2. Momentum
Momentum concerns the strength and persistence of recent price movement. A bullish indication accompanied by improving momentum may present a different analytical situation from one that appears while momentum is fading. The same principle applies to potential sell indications.
A momentum indicator for TradingView can help traders examine whether movement is accelerating, slowing or showing disagreement with price. Momentum should not be treated as a guarantee that price will continue. Instead, it adds another layer of evidence to the chart review.
3. Market structure
Market structure provides a framework for understanding swings, breaks and changes in directional behaviour. Events such as a break of structure, often abbreviated as BOS, can help traders examine whether price has moved beyond a prior structural reference. A change of character, or CHoCH, can be used as another way to describe a possible shift in how price is behaving.
These events require careful interpretation. A structural break on one timeframe may not represent a major change on a higher timeframe. Reviewing the surrounding price action helps prevent a single event from being given more importance than it deserves.
4. Participation and market flow
Participation refers to the broader activity and flow that may accompany price movement. Smart money concepts and institutional flow analysis are often used to examine whether price action appears consistent with areas of significant interest or changing market behaviour.
A smart money indicator can organise this type of information on the chart, but the label should not be understood as proof of what every institutional participant is doing. It is better viewed as an analytical framework that can help traders study flow, structure and potential areas of interest together.
What to look for in the best trading indicator buy and sell features
The most useful feature set is not necessarily the one with the greatest number of alerts or chart labels. Traders may benefit more from a tool that presents related information in a way that supports a repeatable review process. For buy-and-sell analysis, several capabilities are particularly relevant.
| Feature area | What it can help you review | Question to ask |
|---|---|---|
| Trend analysis | Directional bias across the selected chart context | Is the indication aligned with or opposed to the broader trend? |
| Momentum evaluation | Strength, weakness or disagreement in recent movement | Is momentum supporting the potential setup? |
| Market structure | BOS, CHoCH and changes in swing behaviour | Has price changed structure, or is it still ranging? |
| Market flow | Participation and smart money concepts | Does the flow context add support or introduce uncertainty? |
| Multi-timeframe analysis | Relationship between shorter and longer chart views | Are the relevant timeframes broadly consistent? |
| Alerts and dashboard context | Organised monitoring of selected conditions | Can the information be reviewed without relying on one notification? |
Multi-timeframe confirmation
Markets can look different depending on the timeframe. A lower timeframe may show a developing move while a higher timeframe displays a range or an opposing trend. Multi-timeframe analysis helps place a local indication within a wider chart view.
The purpose is not to force every timeframe to agree. Markets rarely offer perfectly aligned information at every level. Instead, the trader can identify whether a potential setup is aligned with the larger context, occurring against it, or developing in a period of uncertainty.
Structure events such as BOS and CHoCH
Structure events can make changes in price behaviour easier to review. A BOS may draw attention to movement beyond a previous structural point, while a CHoCH may highlight a possible change in directional behaviour. These concepts can be useful when combined with trend and momentum rather than treated as standalone trade instructions.
It is also important to consider the quality of the structural reference. A minor swing on a short timeframe can produce a different interpretation from a major swing visible on a longer timeframe. The surrounding chart, the timeframe and the strength of the move all influence how the event should be assessed.
Fibonacci projections and reference levels
Fibonacci projections can provide additional reference points when reviewing a potential setup. They may help traders examine possible areas of interest in relation to an existing move. However, a projected level is not a guaranteed target, and it should not be treated as evidence that price must reach a particular point.
Reference levels are most useful when they are considered alongside structure, momentum and volatility. A level that appears relevant on one chart may have less significance when the wider market context is unclear.
Volatility-based target and risk references
Volatility-based references can help traders think about how much price movement may be present in the current conditions. They can support chart planning by showing reference areas for potential targets or risk review, but they do not determine an appropriate position size or remove trading risk.
Every trader still needs to consider their own method, risk tolerance and decision rules. An indicator can display analytical references, while the responsibility for evaluating a setup remains with the user.

How AKMelytics brings these elements together
AKMelytics – Smart Money Indicator is a TradingView technical analysis tool offered by VP ALGO TRADING. Its feature set combines algorithmic analysis related to momentum, trend, market structure, market flow, relative strength and smart money concepts.
The indicator also includes multi-timeframe analysis, BOS and CHoCH structure events, Fibonacci projections, volatility-based target and risk reference levels, dashboard context and configurable TradingView alerts. Together, these features are intended to help traders review potential trading setups from several angles rather than depend only on a single buy or sell label.
Using the dashboard as a review aid
A dashboard can make multiple conditions easier to scan. For example, a trader may use it to compare trend and momentum information across selected timeframes before returning to the price chart for closer inspection. This can make the review process more organised, particularly when several conditions need to be considered.
A dashboard should still be treated as a summary rather than a replacement for chart analysis. The details of price structure and the location of a potential indication remain important.
Using configurable alerts carefully
Configurable alerts can help traders monitor selected conditions in TradingView without watching the chart continuously. An alert may bring attention to a change, but it does not provide the full context of the market at the moment it is received.
When an alert appears, it is useful to return to the chart and review the surrounding trend, momentum, structure and participation information. This keeps the notification in its proper role: a prompt for analysis rather than an automatic instruction to act.
A practical review process for buy-and-sell indications
A consistent process can help reduce impulsive reactions to individual chart markers. The following sequence is one way to structure an analysis session.
- Define the chart context. Identify the instrument and timeframe being reviewed, then consider whether a higher timeframe is needed for additional perspective.
- Check the dominant trend. Review whether the broader movement is upward, downward or range-bound.
- Examine momentum. Look for confirmation, weakening movement or disagreement between momentum and price.
- Review market structure. Identify relevant swing points and assess whether a BOS or CHoCH event has meaningful context.
- Consider participation and flow. Use smart money and market-flow information as supporting context, not as proof of future movement.
- Review reference levels. Examine any Fibonacci, volatility or risk references in relation to the current structure.
- Decide whether the setup meets your rules. If the information is conflicting or unclear, waiting and gathering more context is also a valid decision.
Example of a bullish indication
Suppose a buy indication appears after a short-term decline. The first question is not whether the marker is correct. Instead, review whether the higher timeframe trend is supportive, whether momentum is recovering, and whether price has produced a meaningful structural change. If the indication occurs directly below a significant resistance area or while broader momentum remains weak, the setup may require more caution and further review.
Example of a bearish indication
A sell indication can be reviewed in the same way. Consider whether the wider trend is declining, whether momentum is weakening, and whether price has broken a relevant support or changed its structure. If the indication appears during a strong higher-timeframe uptrend, it may represent a short-term pullback rather than a complete reversal. The point is not to predict the outcome but to understand the condition being displayed.
Common mistakes when evaluating buy-and-sell indicators
Acting on a single label
The clearest chart label can still be incomplete information. Relying on one signal may cause traders to overlook trend conflict, nearby structure or a lack of momentum. A structured checklist can encourage a broader review.
Adding too many indicators
More tools do not necessarily create better analysis. Several indicators may measure similar information, producing a crowded chart and conflicting messages. A tool that combines related areas can be useful when it makes the relationship between them easier to understand, but simplicity should remain a priority.
Ignoring timeframe differences
A signal on a short timeframe can look persuasive until it is compared with the higher-timeframe structure. Timeframe differences are not automatically a problem, but they should be recognised before a trader decides how much importance to assign to a local move.
Treating alerts as trade instructions
Alerts are convenient, but they do not know a trader’s complete plan, risk limits or personal circumstances. An alert should start a review of the chart, not bypass it.
Expecting certainty from technical analysis
Technical analysis works with changing market information and uncertainty. No indicator can guarantee profitable results, eliminate losses or ensure that a displayed indication will lead to a particular outcome. Responsible use requires independent judgement and appropriate risk awareness.
Who may benefit from a structured TradingView indicator?
A structured TradingView indicator may be useful for beginners who want a clearer way to organise several technical concepts, as well as more experienced traders who want trend, momentum, structure and smart money information available in one analytical environment. The value depends on how well the tool fits the trader’s existing process and how consistently its information is evaluated.
It is not a substitute for learning market structure, understanding volatility or developing personal decision rules. Traders should take time to understand what each feature represents and how it behaves in different market conditions before relying on it as part of their analysis.
Questions to ask before choosing a buy-and-sell indicator
- Does the tool provide context beyond a simple buy or sell label?
- Can trend and momentum be reviewed together?
- Does it include market structure information such as BOS or CHoCH?
- Can multiple timeframes be assessed?
- Are alerts configurable rather than treated as automatic instructions?
- Does the product explain that it supports analysis instead of providing financial advice?
For traders considering the AKMelytics – Smart Money Indicator, VP ALGO TRADING provides the tool for use with TradingView and offers support for installation, activation or usage assistance. The website also describes a request-based seven-day free trial for the indicator and Telegram channel. Product access instructions require customers to provide their TradingView ID by email after purchase.
FAQ: Best trading indicator buy and sell features
What is the best trading indicator buy and sell tool?
There is no single tool that is best for every trader or market condition. A useful buy-and-sell indicator should provide context that can be reviewed with trend, momentum, market structure and participation rather than relying on one isolated label.
Can the AKMelytics Smart Money Indicator guarantee profitable trades?
No. AKMelytics is designed to support technical analysis and decision-making. It does not guarantee profits, eliminate losses or provide financial advice.
What does a smart money indicator show?
A smart money indicator can organise information related to smart money concepts, market flow, structure and participation. It should be treated as an analytical framework, not proof of the future actions of institutional participants.
Why should buy-and-sell indications be checked across timeframes?
Different timeframes can show different stages of a move. A short-term buy indication may occur inside a broader downtrend, while a sell indication may appear during a pullback in a larger uptrend. Multi-timeframe review helps place the signal in context.
What are BOS and CHoCH in market structure analysis?
BOS generally refers to a break of structure, while CHoCH refers to a change of character. Both can help traders examine changes in price behaviour, but their meaning depends on the timeframe and surrounding market structure.
Are TradingView alerts automatic trading signals?
No. Alerts notify traders that a selected condition has occurred. The trader should return to the chart and review the complete context before making any decision.
Who is the AKMelytics indicator designed for?
It is designed for TradingView users, including beginners and experienced market participants, who want a structured way to review trend, momentum, market structure, institutional activity and smart money conditions.


Recent Comments