
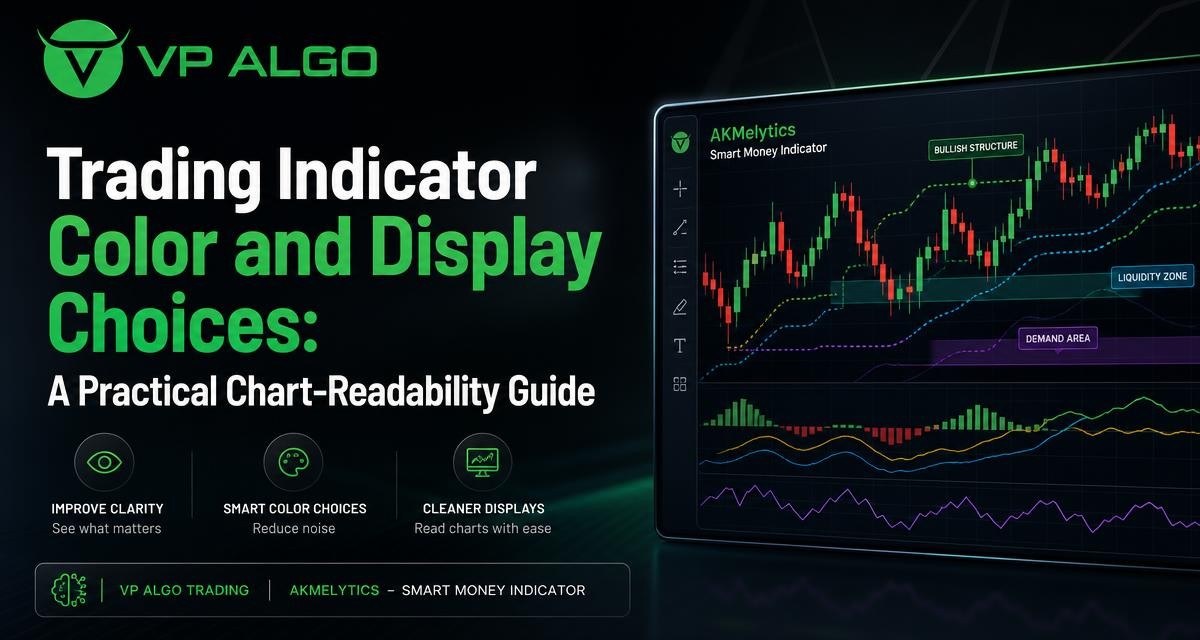
A trading indicator can provide useful analytical context, but a crowded or poorly organized chart can make that information difficult to inspect. Color, line style, label placement, panel selection, and visibility settings all affect how quickly you can distinguish one chart element from another. These presentation choices do not change the calculations or make a setup more reliable. They simply help you arrange the information so that your analysis is easier to follow and review.
Why chart readability matters
When several indicators, drawings, alerts, and price annotations appear on the same chart, the main challenge is often visual organization rather than a lack of information. A trader may need to identify the current trend, review momentum, inspect market structure, and compare a higher-timeframe context. If every element uses a bright color, thick line, or large label, the chart can become visually noisy.
A readable chart creates a clear hierarchy. Price action remains the primary reference, while supporting information is visible without competing for attention. This can make it easier to ask consistent questions: What is price doing? Which signals are active? Which conditions are confirmed, and which are only contextual? The answers still depend on the underlying market data and the trader’s process, but a clearer display can reduce avoidable confusion.
Presentation is not the same as analysis
Changing a trading indicator from a red line to a blue line does not change its formula, signal conditions, or historical calculations. Hiding a label does not remove the event from the indicator’s logic, and increasing the line width does not make a trend stronger. Display settings affect what is visible and how it is perceived; they do not improve the market outcome represented by the data.
This distinction is especially important when reviewing screenshots, comparing chart layouts, or testing a new configuration. A cleaner appearance can make a tool easier to use, but it should not be treated as evidence that the tool is more accurate. Keep visual preferences separate from decisions about whether an indicator fits your analytical method.
Start with a visual hierarchy
A useful chart normally has a clear order of importance. The price candles or bars should remain easy to see, while the most relevant indicator information receives the strongest visual emphasis. Secondary context can use softer colors, thinner lines, or a separate panel.
One practical hierarchy is to give primary structure a clear but restrained style, use moderate contrast for active signals, and reserve the strongest colors for events that require attention. This approach avoids making every element look equally urgent. It also leaves room for a trader to notice an unusual condition without scanning through a chart where everything is already highlighted.
| Chart element | Useful display priority | Possible visual treatment |
|---|---|---|
| Price action | Highest | Keep candles or bars clear and unobstructed |
| Trend direction | High | Use a consistent line or restrained background tint |
| Market structure events | High when relevant | Use distinct labels or symbols with limited repetition |
| Momentum information | Medium | Place in a separate panel or use a moderate contrast |
| Institutional or smart money context | Medium | Use clear zones, lines, or labels without covering price |
| Alerts and exceptional events | Attention-based | Reserve a stronger accent color for conditions requiring review |
Choosing colors for a trading indicator
Color can help users separate categories of information, but too many colors can create another layer of interpretation. A simple palette is usually easier to remember and apply consistently. For example, one color family may represent bullish context, another bearish context, and a neutral tone may represent information that is descriptive rather than directional.
Color should not be the only way to identify a signal. Similar shades can appear different across screens, chart themes, and lighting conditions. Some users may also have difficulty distinguishing certain color combinations. Pairing color with a label, line pattern, symbol, position, or other visual cue makes the chart more dependable to read.
Use meaning consistently
If green represents a bullish condition in one part of the chart, using green for an unrelated neutral measurement can create hesitation. The same applies to red, yellow, blue, and other accent colors. A consistent visual vocabulary reduces the amount of interpretation required each time you open the chart.
- Assign one meaning to each major color family.
- Use neutral tones for background context or reference information.
- Reserve high-saturation colors for conditions that deserve attention.
- Check that text and lines remain visible against the chart background.
- Use labels or shapes alongside color where possible.
Light and dark chart themes
A palette that looks clear on a dark theme may be too bright on a light theme. Before settling on a layout, inspect the chart with the theme you actually use for analysis. Pay attention to faint structure lines, zone boundaries, label text, and any colors that appear nearly identical.
It is also useful to review the chart at different zoom levels. A color combination may look balanced when viewed closely but become indistinct when the chart shows a longer section of historical price action. The goal is not to create a visually striking chart; it is to preserve useful distinctions during normal analysis.
Line styles, thickness, and transparency
Line weight is another way to communicate priority. A thick line naturally attracts more attention than a thin line, so it should be used for information that you regularly need to identify. If every moving level, structure boundary, and reference line is thick, the chart loses its hierarchy.
Line styles can add meaning without requiring additional colors. Solid lines may be used for active or primary references, while dashed or dotted lines can distinguish projections, historical levels, or secondary context. The exact assignment is a personal preference, but it should remain consistent across charts.
Transparency is useful for zones, backgrounds, and overlapping areas. A highly opaque block can hide candles and make structure difficult to inspect. A more transparent area may preserve the context while allowing price to remain visible. Adjust transparency until both the marked area and the candles can be read without one overwhelming the other.
Managing labels and chart annotations
Labels can explain a trading indicator’s output, but repeated labels often become the main source of clutter. A chart that displays every event name at full size may be informative in a close review yet impractical for routine scanning. Consider which labels help you make a decision and which can be reviewed through a settings panel, data window, or a less prominent marker.
Keep labels close to their purpose
Labels are easier to interpret when they appear near the event or level they describe. However, labels should not cover the relevant candle or obscure a market structure boundary. If multiple labels appear in the same area, use shorter wording, smaller text, or a separate visual marker where the platform allows it.
- Show the most important event names and hide repetitive annotations.
- Use a consistent position for similar labels.
- Avoid placing text directly over a candle when the candle shape matters.
- Review whether a label adds information beyond its color or symbol.
- Use fewer annotations when zooming out to a broader timeframe.
Separate price overlays from indicator panels
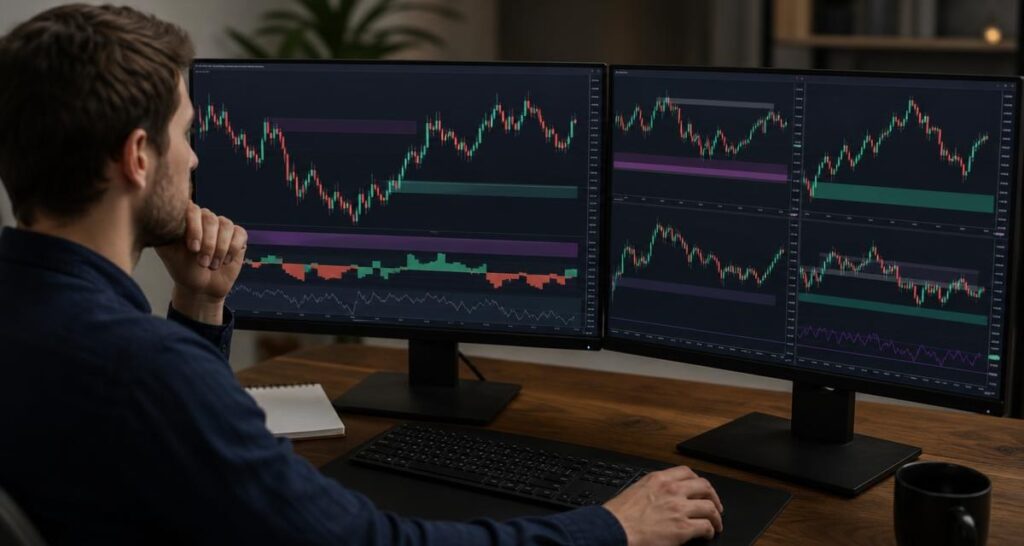
Some information belongs directly on the price chart. Trend references, market structure levels, zones, and selected smart money concepts may be easier to understand when aligned with candles. Other information, such as momentum measurements, can be clearer in a separate panel below the chart.
There is no universal rule for which elements must be overlaid or separated. The right choice depends on how the information is used. If an element needs to be compared directly with a specific price level, an overlay may be practical. If it has its own scale or contains several oscillating values, a separate panel may prevent the price chart from becoming distorted or crowded.
Use one chart for scanning and another for review when needed
A compact chart can help with a quick scan, while a more detailed layout can support closer inspection. Instead of forcing every available feature into one view, consider maintaining a basic layout and a review layout. The basic version might show price, trend context, and only the most important structure events. The review version can include additional momentum, flow, or smart money information.
This approach can be relevant when using a TradingView trading indicator with several analytical components. A tool such as AKMelytics – Smart Money Indicator is described as combining momentum, trend analysis, market structure, market flow, relative strength, smart money concepts, multi-timeframe analysis, Fibonacci projections, volatility-based reference levels, dashboard context, and configurable alerts. The display does not need to show every component at maximum prominence at the same time. Organizing those outputs according to the question being asked may make the chart easier to inspect.
Organizing multi-timeframe information
Multi-timeframe context can add useful perspective, but it can also create uncertainty if the chart does not clearly distinguish timeframes. A higher-timeframe trend reference should be visually different from a lower-timeframe event when both appear together. Otherwise, the viewer may mistake broader context for a current entry condition or treat a short-term change as a larger trend shift.
Use labels, line styles, panel headings, or a restrained color distinction to identify the source timeframe. Keep the terminology consistent. If a dashboard shows higher-timeframe conditions, make sure it is visually separate from markers generated on the active chart timeframe. Clear separation supports interpretation, but it does not resolve differences between timeframes or predict how price will develop.
Reducing visual noise without hiding useful information
Decluttering does not mean removing every inconvenient signal. It means deciding which information should be immediately visible, which should be available on closer inspection, and which is not relevant to the current analytical task. A useful first step is to turn off one display element at a time and observe whether the chart becomes easier to understand without losing an important reference.
Try reviewing the chart in three states: a clean price-only view, a core indicator view, and a full review view. The price-only view can help you inspect candles and structure without visual assistance. The core view can support routine analysis. The full view can be used when investigating a particular condition or checking how several outputs relate to one another.
A practical decluttering checklist
- Identify the main question the chart is meant to answer.
- Keep only the indicator outputs that relate directly to that question.
- Reduce the intensity of secondary lines and background zones.
- Hide labels that repeat information already visible elsewhere.
- Check that price candles remain readable at the chart’s normal zoom level.
- Review the layout after changing timeframe, symbol, or chart theme.
Display choices for alerts and decision support
Alerts can draw attention to conditions that deserve review, but an alert marker is not the same as a completed trading decision. A chart may show that a defined condition has occurred while leaving other questions unresolved, including market context, risk, timing, and whether the condition fits your method.
For that reason, alert colors and markers should be noticeable without being mistaken for automatic instructions. If both bullish and bearish conditions use very strong colors, the chart may encourage rapid reactions. A more measured approach is to make alert markers visible, then use labels or a dashboard to provide the relevant context for further inspection.
Testing a chart layout before relying on it
It is easy to become accustomed to a layout and assume that familiarity means clarity. A short review process can reveal whether the display actually supports consistent analysis. Test the layout on different sections of historical data, at the timeframes you normally examine, and with both active and quiet market conditions. This checks readability rather than future performance.
Ask another trader to describe what the chart appears to show without explaining your color scheme first. If the person cannot distinguish the main trend, current signal, and secondary context, the layout may need simplification. You can also take a break and revisit the chart later; unclear labels and competing colors are often easier to notice with fresh attention.
| Review question | What to check |
|---|---|
| Can price be seen clearly? | Confirm that lines, zones, and labels do not cover important candles. |
| Can the main signal be identified? | Check whether the primary output stands out from secondary context. |
| Are timeframes distinguishable? | Look for clear differences between higher-timeframe and active-timeframe information. |
| Are colors consistent? | Make sure the same color does not represent conflicting meanings. |
| Are alerts being overemphasized? | Ensure a marker invites review rather than appearing to be a guaranteed instruction. |
How a structured indicator can fit a readable workflow
A structured trading indicator can bring several types of information into one TradingView workspace. That may be useful for traders who want to examine trend, momentum, market structure, institutional activity, and smart money conditions in a more organized way. The value of the display comes from helping the user review those categories systematically, not from adding more colors or signals to the screen.
When configuring a tool such as AKMelytics – Smart Money Indicator, begin with the outputs that match your current workflow. Enable the features you understand, place related information where it can be compared easily, and keep less frequently used context available without allowing it to dominate the chart. The indicator is intended to support analysis and decision-making, not to provide financial advice or guarantee results.
Common mistakes with indicator display settings
Using too many colors
Every extra color creates another distinction the viewer must remember. A limited palette is generally easier to interpret, especially when several signals occur close together.
Making every signal prominent
If all events use thick lines, large labels, and high contrast, the chart cannot communicate priority. Strong emphasis should be reserved for information that genuinely needs immediate attention.
Confusing visual appeal with analytical quality
A polished chart can still contain an unsuitable indicator or an inconsistent process. Evaluate the logic, definitions, and role of each output separately from its appearance.
Changing settings without documenting them
If you frequently change colors, visibility, or label rules, record what each setting means. Documentation helps prevent one layout from silently developing a different interpretation from another.
Final thoughts
Good chart design is a practical part of technical analysis. A consistent palette, sensible line hierarchy, restrained annotations, and clear separation between overlays and panels can make a trading indicator easier to inspect. These choices improve communication between the chart and the user, but they do not change the underlying calculations, remove uncertainty, or guarantee a particular result.
Build the display around the questions you need to answer, test it at normal zoom levels and timeframes, and keep visual emphasis proportional to analytical importance. Whether you use a basic tool or a multi-feature TradingView indicator, readability is most useful when it supports a disciplined review process rather than replacing one.
Frequently asked questions
Can changing a trading indicator’s color improve its accuracy?
No. Changing color affects presentation only. It does not alter the indicator’s calculations, signal conditions, or historical data.
How many colors should a TradingView chart use?
There is no fixed ideal number, but a restrained palette is usually easier to interpret. Assign colors consistent meanings and use additional visual cues such as labels, symbols, or line styles.
Should all trading indicator signals be displayed at once?
Not necessarily. Show the outputs relevant to the current analytical task and keep secondary information available in a less prominent layout or review view.
Should momentum information appear on the price chart?
Momentum information is often easier to inspect in a separate panel, particularly when it has its own scale. The best arrangement depends on how you compare it with price and other chart elements.
How can I make multi-timeframe signals easier to understand?
Distinguish timeframes with consistent labels, line styles, panel headings, or restrained color differences. Make sure higher-timeframe context cannot easily be mistaken for an active-timeframe event.
Do clearer colors make an indicator more profitable?
No. Clearer colors can make information easier to review, but they do not guarantee profitable trading, eliminate losses, or predict future market results.
What should I check before using a new TradingView trading indicator layout?
Check that price remains visible, the main outputs are distinguishable, labels do not obscure candles, timeframes are clear, and the display supports your intended analysis without creating unnecessary noise.


Recent Comments