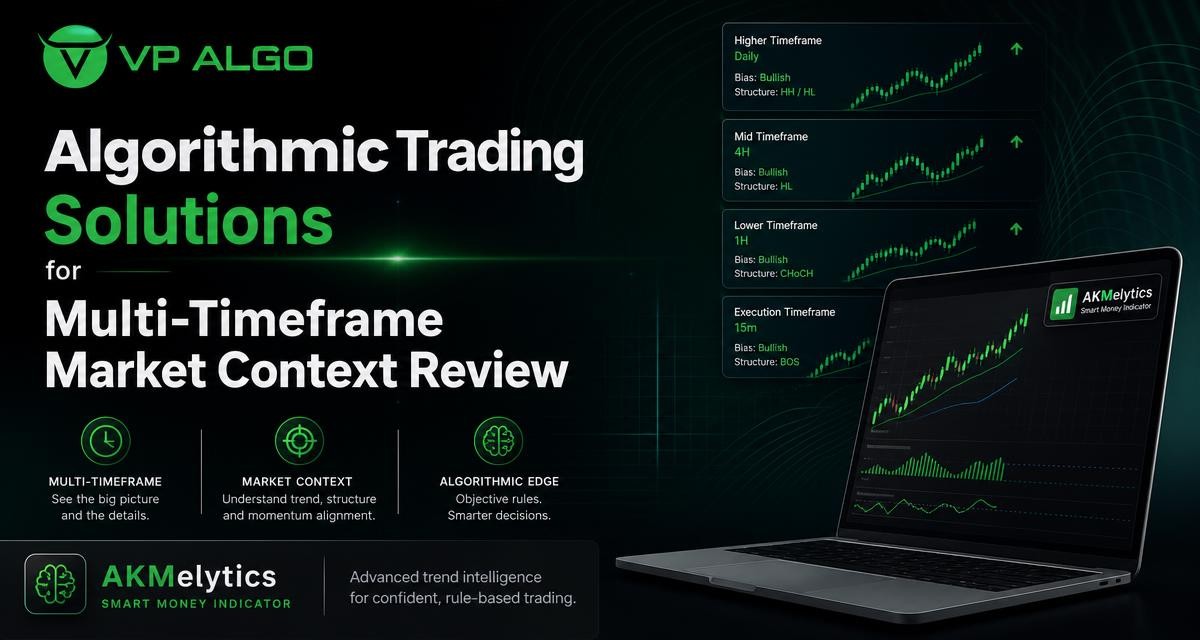
Algorithmic trading solutions can help TradingView users organise several types of market information in one analytical workflow. Instead of reviewing trend, momentum, market structure and smart money observations separately, traders may prefer a tool that presents related context across multiple timeframes. The goal is not to remove uncertainty or guarantee a result. It is to create a clearer framework for studying potential setups and making independent trading decisions.
Why multi-timeframe context matters
A chart can look constructive on one timeframe while showing a very different condition on another. A short-term move may be part of a broader retracement, and a strong-looking breakout may occur within a larger range. Reviewing more than one timeframe helps traders consider where a current movement sits within the wider market picture.
This approach is useful for both beginners and experienced market participants because it encourages questions before a setup is assessed. Is the broader trend rising, falling or unclear? Does momentum support the current move? Has market structure changed? Are signs of market flow or smart money activity aligned with the chart direction? A multi-timeframe tool does not answer these questions with certainty, but it can make the review more systematic.
| Area of review | Question a trader may ask | Why it can be useful |
|---|---|---|
| Trend | What is the directional condition on each timeframe? | Helps distinguish a broad move from a shorter-term fluctuation. |
| Momentum | Does current price movement have supporting strength? | Adds context to whether a move is developing, weakening or mixed. |
| Market structure | Have important highs, lows or structure events changed? | Provides a framework for reviewing continuation and possible shifts. |
| Market flow | What related flow or relative-strength observations are visible? | Encourages broader evaluation rather than relying on price direction alone. |
| Smart money concepts | Are there observations that may add context around market behaviour? | Supports a more structured review of potential trading setups. |
What to evaluate in algorithmic trading solutions
The phrase algorithmic trading solutions can describe many different tools. Some focus on automated execution, while others are TradingView indicators that use programmed calculations to organise technical observations. For traders who want decision-support software rather than an automatic trading system, the distinction is important.
When evaluating a TradingView indicator, consider what information it brings together, how clearly that information is displayed, and whether it fits the way you already review charts. A crowded interface can make analysis harder, while a well-organised dashboard may help you see whether different observations agree or conflict.
1. Breadth of analytical context
A useful indicator may combine several analytical areas instead of presenting a single isolated signal. The Delphi Intelligence Smart Money Indicator from VP ALGO TRADING is described as combining trend analysis, momentum evaluation, market structure, market flow, relative strength and smart money concepts. This wider context can help traders examine a potential setup from more than one angle.
That does not mean every component will point in the same direction. Mixed readings are part of market analysis. In some situations, a trend observation may look positive while momentum is weakening or structure remains unclear. A tool should therefore be assessed not only by the signals it displays, but also by whether it helps users recognise disagreement and uncertainty.
2. Multi-timeframe trend assessment
A trend indicator for TradingView is more useful when traders understand the timeframe behind its reading. A bullish condition on a lower timeframe does not automatically establish a bullish condition on a higher timeframe. Multi-timeframe assessment can help separate broad directional context from shorter-term movement.
Users may choose to begin with a wider timeframe to review the general market condition, then move to a lower timeframe to study structure and momentum in more detail. The exact timeframe combination depends on the trader’s method and the market being reviewed. There is no single arrangement that should be treated as suitable for everyone.
3. Market structure observations
Market structure gives traders a way to describe how price develops through highs, lows and changes in directional behaviour. The AKMelytics Smart Money Indicator includes BOS and CHoCH structure events. These terms are commonly used to describe a break of structure and a change of character, but their appearance should still be interpreted within the surrounding chart context.
A structure event is not a guarantee that a new trend will continue. Traders may review where the event occurred, what preceded it, whether momentum supports it, and how it relates to higher-timeframe conditions. Treating a single label as a complete trading decision can oversimplify the analysis.
4. Momentum and relative strength
Trend and momentum are related, but they are not identical. Trend describes directional behaviour over a period, while momentum can provide additional context about the strength or pace of a move. A momentum indicator for TradingView may help users consider whether a move is supported, losing force or developing in a conflicted environment.
Relative strength observations can add another layer to this review. They may help traders compare the character of a movement within their broader chart analysis, but they should not be treated as a standalone prediction. The most useful question is often whether momentum and relative-strength information adds context to the trend and structure readings already under review.
5. Market flow and smart money concepts
Smart money concepts are used by many traders to study market structure, liquidity-related behaviour and possible institutional activity. An institutional flow indicator may present observations intended to support this type of review. However, labels suggesting institutional or smart money activity should be treated as analytical information, not proof of the intentions or actions of a specific market participant.
The Delphi Intelligence Smart Money Indicator is designed to combine smart money analysis with other technical observations. This can be useful for traders who want to keep these concepts in the same workflow as trend, momentum and structure. Even so, users should apply their own rules for confirmation, position sizing and risk management.
How to review a potential setup across timeframes
A repeatable review process can make a TradingView indicator easier to use. The following sequence is an example of how a trader might organise observations. It is an educational framework, not a recommendation to take any particular trade.
- Start with the broadest relevant context. Review whether the higher timeframe appears directional, range-bound or uncertain. Note important structural areas and avoid deciding on an entry before this first review is complete.
- Check the intermediate timeframe. Look for evidence that the shorter-term movement is aligned with, correcting against or disconnected from the broader condition. Pay attention to whether trend and market structure observations agree.
- Study the lower timeframe. Use the more detailed chart to examine momentum, structure events and potential setup development. A lower-timeframe signal should be viewed as part of the wider context rather than as an isolated instruction.
- Compare the dashboard information. If the indicator provides a dashboard, review whether its readings are consistent or mixed across timeframes. Conflicting readings may be a reason to continue observing rather than forcing a conclusion.
- Define the decision rules independently. Decide in advance what would support further analysis, what would invalidate the idea and how risk would be considered. An indicator can organise observations, but it does not replace a trader’s process.
Features that may support practical chart review
Dashboards and configurable alerts
A dashboard can make multi-timeframe information easier to scan, particularly when a trader is reviewing several chart conditions. The value of a dashboard depends on whether its presentation is understandable and whether the user knows how each reading is generated or defined.
Configurable TradingView alerts may also help users monitor conditions without repeatedly checking every chart manually. Alerts should be treated as prompts for further review, not as automatic confirmation of a trade. Before relying on them, users should understand which event triggers an alert and whether the setting matches their intended timeframe.
Fibonacci projections and reference levels
The AKMelytics Smart Money Indicator includes Fibonacci projections and volatility-based target and risk reference levels. These features can help traders mark areas for consideration during chart analysis. They do not establish that price must reach a projected level, and they should not be mistaken for guaranteed targets or fixed risk outcomes.
Reference levels are most useful when considered alongside market structure and current volatility. A trader may ask whether a level is supported by the broader chart, whether the market is moving with enough consistency to make the reference meaningful, and what would change the original interpretation.
What algorithmic trading solutions cannot replace
Even a feature-rich trading indicator cannot replace market knowledge, risk controls or personal responsibility. Technical tools process and display information according to their design, but market conditions can remain ambiguous. A signal may appear after a move has already developed, or several readings may conflict.
- Risk management: Users still need their own approach to exposure, invalidation and acceptable loss.
- Market understanding: Traders should learn what trend, momentum, structure and smart money labels represent before using them in analysis.
- Independent judgement: Indicator output should support decision-making, not remove it.
- Testing and review: Users can study how a tool behaves in their own workflow before relying on it for live decisions.
- Expectation management: No indicator eliminates uncertainty or guarantees profitable results.
VP ALGO TRADING positions its indicators for educational and trading-decision assistance purposes rather than as financial advice. That distinction matters when comparing algorithmic trading solutions. A tool can provide structured observations without being a broker, investment manager or financial adviser.
Who may benefit from a multi-timeframe TradingView indicator?
A multi-timeframe indicator may suit traders who want a more organised way to review several conditions on TradingView. Beginners may appreciate having trend, momentum and structure observations presented together while learning how those concepts relate. More experienced traders may use the same information as a screening or confirmation layer within an existing process.
It may be less suitable for someone looking for an automatic trading bot, guaranteed buy-and-sell calls or personalised financial guidance. The product described here is a TradingView technical analysis tool, not a promise of automatic execution or a substitute for a complete trading plan.
Questions to ask before choosing a tool
Before selecting algorithmic trading solutions, prospective users can review the following practical points:
- Does the tool provide the types of context you actually use, such as trend, momentum, structure and smart money analysis?
- Can you understand how its labels, dashboard readings and alerts relate to the chart?
- Does the multi-timeframe display fit your normal analysis process?
- Can you configure the tool without creating unnecessary visual clutter?
- Is the product presented as decision support rather than a guarantee of outcomes?
- What installation or activation process is explained by the provider?
VP ALGO TRADING states that customers provide their TradingView ID by email after purchase for product access, and that support can be contacted for installation, activation or usage assistance. The website also offers a request-based 7-day free trial for its indicator and Telegram channel. Prospective users should review the current provider information directly for any applicable conditions.
Final perspective
The strongest reason to consider a multi-timeframe TradingView indicator is not the promise of a perfect signal. It is the possibility of bringing several relevant observations into one repeatable review. Trend, momentum, market structure, market flow, relative strength and smart money concepts can each contribute context, but none should be treated as a certainty on its own.
Algorithmic trading solutions such as the AKMelytics Smart Money Indicator may be worth evaluating when a trader wants structured chart information and configurable tools inside TradingView. The right choice depends on whether the product’s features are clear, relevant to the user’s process and compatible with independent analysis and risk management.
Frequently asked questions
What are algorithmic trading solutions?
Algorithmic trading solutions are tools that use programmed calculations or rules to process market information. In this context, the solution is a TradingView indicator designed to organise technical observations, not a guarantee of automatic profits or financial advice.
What does a multi-timeframe indicator show?
It can show related market observations across more than one timeframe, such as trend, momentum and structure conditions. The purpose is to help traders compare broader context with shorter-term movement.
Is the AKMelytics Smart Money Indicator a trading bot?
Based on the supplied product description, AKMelytics is a TradingView technical analysis indicator. It is not described as an automatic trading bot or as a system that executes trades on a user’s behalf.
How does a trend indicator for TradingView support analysis?
It can help present directional observations on a chart or dashboard. Traders still need to consider timeframe, momentum, market structure, risk and other relevant factors before making an independent decision.
What are BOS and CHoCH events?
BOS generally refers to a break of structure, while CHoCH commonly refers to a change of character. They are market-structure observations that should be interpreted with surrounding price action and broader timeframe context.
Can an indicator guarantee profitable trading results?
No. An indicator cannot eliminate market uncertainty, guarantee profits or prevent losses. Its information should be used for education and decision support alongside the user’s own analysis and risk controls.
How can prospective users learn more about the indicator?
Prospective users can review the current information provided by VP ALGO TRADING and contact the company about installation, activation or usage assistance. A request-based 7-day free trial is also offered according to the supplied business information.


Recent Comments