
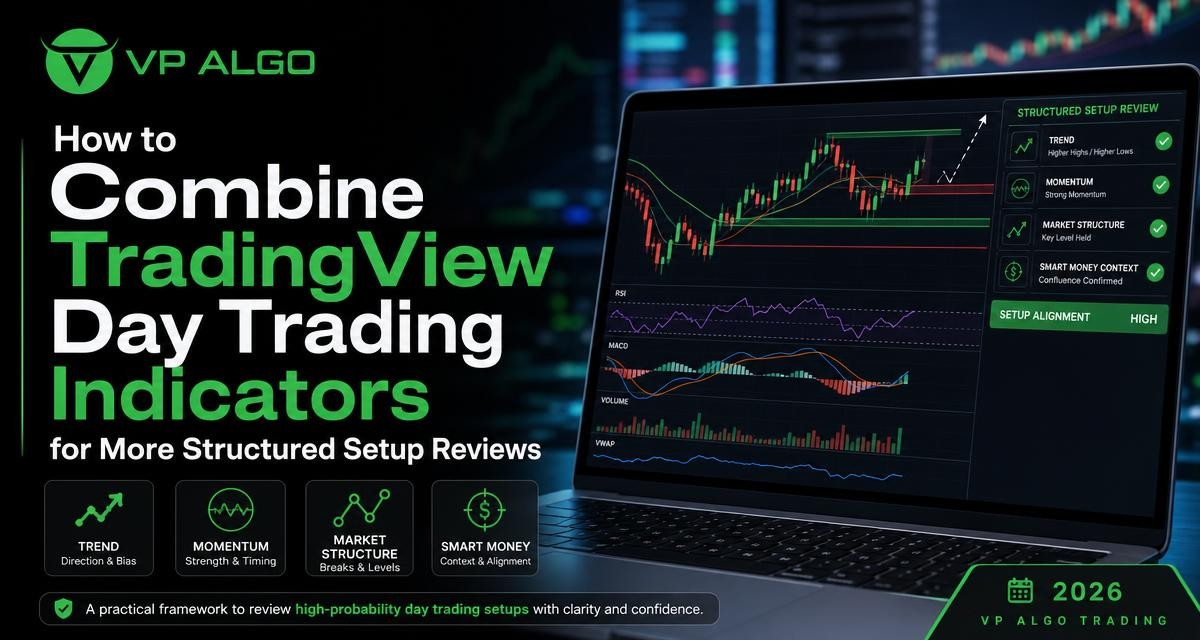
TradingView day trading indicators can make chart analysis more organised, but adding more tools does not automatically create better decisions. A more useful approach is to combine indicators by function: use trend analysis for directional context, momentum for participation, market structure for price behaviour, and smart money or institutional-flow context for additional confirmation. This framework can help traders review potential setups systematically without treating any single signal as a guarantee.
Why combine indicators by role?
Many day traders begin by searching for the best trading indicator, then place several tools on the same chart. The problem is that multiple indicators may be measuring similar information. For example, three trend-following tools can all react to the same price movement, creating the appearance of strong confirmation without adding much independent evidence.
A structured review starts with a different question: What decision should this tool help me make? If one indicator helps establish direction, another evaluates momentum, and a third highlights market structure, each has a defined job. The result is not a prediction machine. It is a repeatable process for examining whether a potential setup has enough supporting context to deserve further attention.
Use confirmation without creating clutter
Confirmation is most useful when each layer addresses a different part of the trade idea. A trend tool may show that price is generally moving upward, while a momentum tool indicates whether buyers are currently active. Market structure can then show whether price is making meaningful higher highs and higher lows, or whether the apparent trend is weakening.
Too many overlapping signals can also encourage late entries. If every tool must turn bullish before a trader acts, much of the original move may already have occurred. The goal is not to collect as many matching readings as possible. It is to define a small number of conditions that make a setup easier to evaluate and easier to reject.
The four analytical layers of a day trading review
A practical framework for TradingView day trading indicators can be built around four layers. These layers do not need to be treated as rigid rules, and they should be adapted to the trader’s timeframe, instrument, and risk process. Their purpose is to separate broad context from entry-focused observations.
| Layer | Main question | What to examine |
|---|---|---|
| Trend | What is the broader directional bias? | Trend direction, alignment across selected timeframes, and whether price is moving or ranging |
| Momentum | Is the current move attracting participation? | Strength, acceleration, weakening momentum, and possible exhaustion |
| Market structure | How is price organising itself? | Swings, breaks, reversals, support and resistance zones, and structural invalidation |
| Smart money context | What additional flow or institutional-activity context is visible? | Relevant activity signals, areas of interest, and whether the context agrees with price behaviour |
1. Start with trend direction
The first step is to establish the market’s general condition. A trend indicator for TradingView can help traders review whether price is making directional progress, moving sideways, or transitioning between the two. This matters because a strategy designed for a clean trend may behave differently during a range.
Trend analysis should begin on a broader chart view than the one used for a precise entry. The purpose is to avoid judging the entire market from a small price fluctuation. A shorter timeframe may show a temporary decline while the broader structure remains upward, or it may show a brief rally inside a larger downward move.
Ask whether the market is trending or ranging
A trend reading is not automatically a trade signal. It is context. When price is moving directionally, traders may focus their review on pullbacks, continuation structures, or breaks that agree with the prevailing bias. When price is ranging, the same indicator may remain less useful for directional decisions because price can repeatedly move from one side of the range to the other.
Record the trend condition in simple language, such as “broader upward bias,” “broader downward bias,” or “unclear and range-bound.” This keeps the first stage of the review descriptive rather than emotional.
2. Add momentum as a timing and quality check
Momentum analysis helps answer whether the current move has energy behind it or is losing force. A momentum indicator for TradingView can be used to examine acceleration, deceleration, and possible divergence between price and momentum. It should not be treated as proof that price must continue in one direction.
For example, a bullish trend with improving momentum may support a continuation review. A bullish trend with fading momentum may require more caution, particularly if price is approaching a previously identified resistance area. Similarly, a sharp momentum reading after an extended move may reflect strength, exhaustion, or both depending on the surrounding structure.
Separate momentum from overextension
Strong momentum can attract attention, but entering after an extended move may create a different risk profile from entering near the beginning of a structured pullback. This is why momentum should be read alongside price location and market structure.
- Improving momentum can support a continuation hypothesis.
- Fading momentum can warn that a move is losing participation.
- A sudden momentum spike may require a review of whether price has become extended.
- Momentum that conflicts with structure should lead to further analysis, not an automatic reversal call.
3. Read market structure before focusing on the entry
Market structure describes how price forms swings and breaks. A market structure indicator can make these features easier to review, but traders should still understand what the plotted information represents. Common observations include higher highs and higher lows in an advancing market, lower highs and lower lows in a declining market, and breaks that may signal continuation or a change in behaviour.
Structure gives a potential setup a logical location. Instead of asking only whether an indicator has changed colour, a trader can ask whether price has held a meaningful swing, broken a relevant level, or returned to an area where the original idea would no longer make sense.
Define the structural invalidation point
Every setup review benefits from a clear point at which the idea is no longer valid. This does not determine the amount of capital at risk, and it does not guarantee that an exit will occur at a particular price. It simply makes the analysis testable.
For a possible long setup, invalidation might involve a failure to hold a relevant higher low or a decisive break below the structure supporting the idea. For a possible short setup, it might involve a break above the swing structure that justified the bearish view. The exact interpretation depends on the chart and the trading plan.
4. Use smart money context as an additional layer
Smart money concepts and institutional-flow context are often used to examine where significant market activity may be influencing price behaviour. A smart money indicator for TradingView can help organise observations related to market structure, institutional activity, and areas of interest. These readings should remain part of the review rather than being treated as direct evidence of a guaranteed outcome.
The useful question is whether the smart money context agrees with the other layers. If trend, structure, and momentum all point in the same general direction, relevant smart money information may add context to the setup. If the readings conflict, the disagreement is itself useful. It may indicate that the chart requires a wider review or that the setup is not sufficiently clear.
Do not confuse a plotted zone with certainty
Zones, labels, and activity markers can make a chart easier to interpret, but they do not remove uncertainty. Price can react differently from what a historical pattern suggests. Traders should therefore examine whether the area remains relevant, how price responds when it reaches it, and whether the wider market condition supports the original interpretation.

How to combine the layers into a repeatable workflow
A consistent process reduces the temptation to change the analysis after seeing a desired signal. The following sequence can be used for a manual review of potential high-probability day trading setups. “High-probability” should describe a setup that meets defined conditions in the trader’s framework, not a promise of a profitable result.
- Describe the broader condition. Decide whether the selected higher timeframe is trending upward, trending downward, or ranging.
- Mark meaningful structure. Identify recent swing points, breaks, reaction areas, and the level that would weaken the trade idea.
- Review the current momentum. Determine whether momentum is supporting the move, fading, or showing a conflicting message.
- Check smart money context. Review relevant activity or smart money information and ask whether it supports or challenges the structural reading.
- Wait for a logical location. A directional bias alone is not an entry. Consider whether price is at a level or in a structure that fits the planned setup.
- Write the invalidation and risk plan. Define what would make the idea unacceptable before focusing on a possible execution.
- Record the review. Save the chart or write a short journal entry so the process can be assessed later rather than judged only by the result of one trade.
Multi-timeframe analysis without conflicting signals
Using more than one timeframe can improve context, but it can also create confusion when each chart is treated as equally important. A useful hierarchy assigns different jobs to different views. The broader timeframe can provide directional context, an intermediate timeframe can show the main structure, and a lower timeframe can be used to examine a possible trigger.
Conflicting readings are normal. A lower timeframe pullback may look bearish while the broader trend remains bullish. Rather than forcing every timeframe to agree, identify whether the conflict represents a normal retracement, a possible reversal, or simply a range. The answer should come from structure and price behaviour, not from the number of indicator signals.
Common mistakes when combining TradingView indicators
Using several tools that measure the same thing
Multiple moving-average variations or similar oscillators may create visual agreement without providing genuinely different information. Choose tools based on their role, then remove anything that does not improve the review.
Treating every signal as an entry
A trend change, momentum shift, or structure label may prompt investigation, but it does not automatically define an entry. Location, invalidation, timing, and risk remain separate parts of the trading plan.
Changing the rules after seeing the outcome
Reviewing a chart after the fact can make a setup appear obvious. A journal should preserve what was visible before the decision, including conflicting signals and reasons for standing aside. This makes the process more honest and helps identify recurring weaknesses.
Ignoring the difference between analysis and advice
Indicators and educational frameworks can assist with chart review, but they do not know a trader’s financial circumstances or risk tolerance. Each trader is responsible for deciding whether a method is appropriate and for testing any process carefully before relying on it.
Where an integrated TradingView indicator can fit
Some traders prefer to assemble separate tools, while others want a more integrated view of trend, momentum, market structure, institutional activity, and smart money concepts. VP ALGO TRADING develops TradingView indicators and algorithmic trading tools for this type of analytical workflow. Its Delphi Intelligence Smart Money Indicator is described as combining these areas to help traders evaluate market conditions and potential setups.
An integrated indicator can reduce the need to switch between disconnected chart elements, but it does not remove the need for interpretation. Traders should learn what each displayed component means, decide which conditions matter to their own process, and avoid assuming that a combined presentation guarantees a better trade. VP ALGO TRADING positions its tools for educational and trading-decision assistance rather than as financial advice.
A practical setup review checklist
Before considering a day trading setup, use a short checklist that can be answered consistently. The checklist should be specific enough to prevent vague reasoning but short enough to use during live chart review.
- What is the broader trend condition?
- Is the market trending or ranging on the relevant chart views?
- What recent structure supports the trade idea?
- Where would the idea become invalid?
- Does current momentum support the expected direction or warn of weakness?
- Does smart money or institutional-flow context add confirmation or introduce conflict?
- Is price in a logical location rather than already extended?
- What would make the best decision to stand aside?
If several answers are unclear, the setup may not be ready for a decision. Passing on an unclear chart is part of a structured process; it is not evidence that the method has failed.
Final perspective
The most useful TradingView day trading indicators are not necessarily the ones with the most signals. Their value depends on whether they help a trader ask better questions in a repeatable order. Trend provides context, momentum describes participation, market structure defines the behaviour of price, and smart money analysis can add another perspective on activity and areas of interest.
Combining these layers can make setup reviews more disciplined, but no indicator can guarantee a result or eliminate losses. The strongest process is one that includes clear invalidation, appropriate risk awareness, honest journaling, and the willingness to remain selective when the evidence is mixed.
Frequently asked questions
What are the main TradingView day trading indicators to combine?
A practical combination can include a trend tool, a momentum tool, a market structure tool, and smart money or institutional-flow context. Each should have a distinct role rather than duplicating the same signal.
Can combining more indicators create high-probability day trading setups?
Combining indicators can create a more defined review process, but it cannot guarantee a high-probability outcome or profitable trade. The quality of the setup still depends on context, price behaviour, execution, and risk management.
Should trend or momentum receive more weight?
Neither should automatically receive more weight. Trend describes broader direction, while momentum describes current strength. Their importance depends on the strategy, timeframe, and market condition being reviewed.
How does market structure improve an indicator-based review?
Market structure connects indicator readings to the way price forms swings and breaks. It can help define relevant levels, possible continuation patterns, and the point where a trade idea is no longer valid.
What should traders do when indicators disagree?
Disagreement is a reason to slow down and investigate, not to add more indicators immediately. Review the timeframe hierarchy, price location, recent structure, and whether the market is ranging or transitioning.
Can a smart money indicator guarantee institutional activity or future price direction?
No. A smart money indicator can organise information related to smart money concepts or institutional-flow context, but it cannot guarantee what market participants will do next or how price will respond.
Is an integrated TradingView indicator suitable for every trader?
Suitability depends on the trader’s experience, method, timeframe, and ability to interpret the displayed information. Any tool should be understood, tested, and used as decision support rather than as financial advice or an automatic guarantee of results.


Recent Comments