
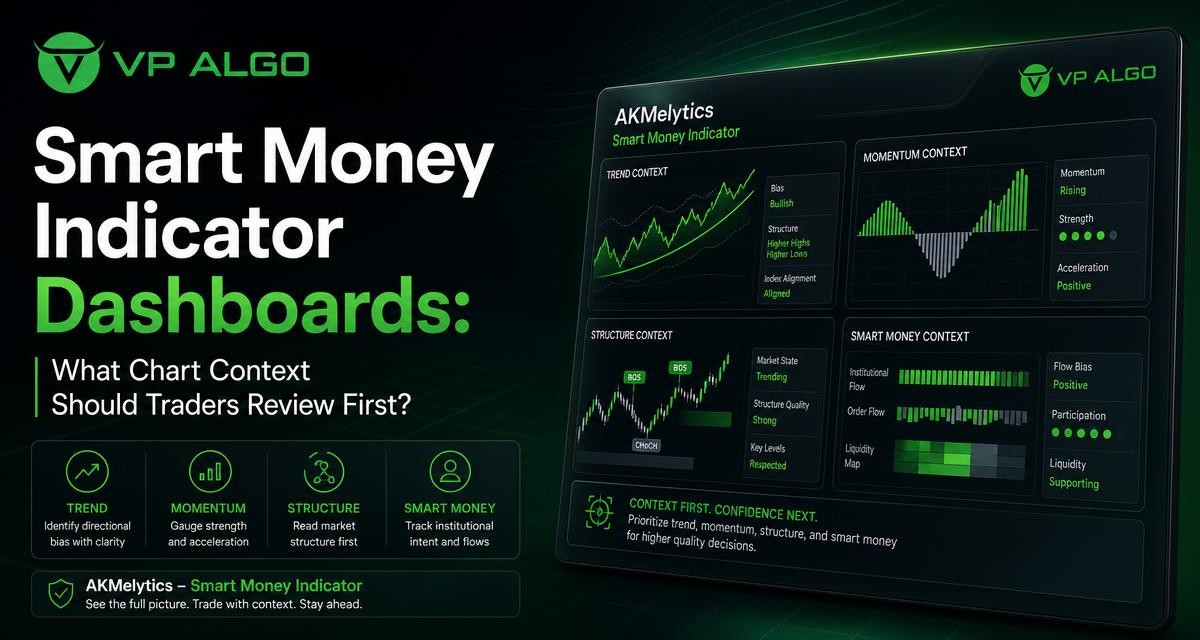
A smart money indicator dashboard can bring several parts of chart analysis into one view, but it does not remove the need for a clear review process. Traders still need to decide which information deserves attention first, how different signals relate to one another, and whether the broader chart context supports further analysis. A practical starting point is to move from higher-level conditions to more specific observations: trend, momentum, market structure, institutional activity and potential setup references.
Why the order of chart review matters
Trading dashboards often display multiple readings at the same time. This can be useful when a trader wants to compare market conditions, but it can also encourage attention to the most noticeable signal rather than the most important context. For example, a momentum change may appear interesting while the broader trend is still moving in the opposite direction. A structure event may also be less meaningful if it is viewed without considering the timeframe and surrounding price action.
Reviewing a chart in a consistent order helps separate context from detail. It does not turn an indicator into a prediction tool, and it does not guarantee a particular market outcome. Instead, it gives traders a repeatable way to ask better questions before they consider whether a chart deserves deeper analysis.
The main dashboard areas to review
A smart money dashboard may combine trend analysis, momentum evaluation, market structure, market flow, relative strength, institutional activity and multi-timeframe observations. Each area answers a different question. Treating them as separate layers can make the dashboard easier to interpret.
| Dashboard area | Question it can help frame | What to avoid |
|---|---|---|
| Trend | What is the prevailing directional environment on the selected timeframe? | Assuming a trend reading predicts the next move |
| Momentum | Is current movement showing strength, weakness or a change in pace? | Treating momentum alone as an entry signal |
| Market structure | Have meaningful highs, lows or structure events changed the chart context? | Reading every small fluctuation as a major break |
| Institutional or smart money observations | What flow or participation clues are being highlighted by the tool? | Assuming the dashboard identifies certain market participants with certainty |
| Multi-timeframe view | Do broader and shorter-term readings provide compatible context? | Ignoring conflicts between timeframes |
| Risk and target references | Where might volatility-based reference levels sit on the chart? | Using reference levels as guaranteed outcomes |
1. Start with the broad trend
The first question should usually be directional: is the chart showing an upward, downward or less clearly directional environment? A trend indicator for TradingView can help organize this first observation by summarizing directional conditions on the selected chart or across multiple timeframes.
This step is about orientation rather than a trade decision. If the broader trend is upward, a trader may want to examine whether short-term weakness is a temporary pullback or evidence of changing conditions. If the broader trend is downward, a brief upward move should be assessed in that context rather than automatically treated as a reversal. When the dashboard shows mixed readings, that uncertainty is itself useful information. It may suggest that the chart needs closer review instead of immediate interpretation.
Use timeframe context before drawing conclusions
A trend reading has meaning only in relation to its timeframe. A short-term chart can show a rising move while a higher timeframe remains weaker. Neither observation necessarily invalidates the other; they describe different layers of the market. A multi-timeframe dashboard can make these differences visible, but the trader still has to determine which timeframe is relevant to the intended analysis.
2. Check momentum after direction
Once the broad trend has been reviewed, examine momentum. Momentum analysis adds information about the pace and strength of movement. It can help a trader consider whether price is continuing with force, losing energy or shifting from one condition to another.
A momentum indicator for TradingView should be treated as context rather than an isolated command. Strong momentum does not automatically mean that movement will continue, and weakening momentum does not by itself confirm a reversal. Instead, compare the momentum reading with the trend and the location of price within the broader chart structure.
Questions to ask when reviewing momentum
- Is momentum aligned with the prevailing trend or moving against it?
- Does the reading suggest continuation, slowing movement or a possible transition?
- Is the momentum change occurring near a meaningful structural level?
- Does the observation appear on one timeframe or across several timeframes?
These questions help prevent a common mistake: treating any change in momentum as equally important. A small short-term shift may matter less than a sustained change that also appears alongside a structural development.
3. Review market structure and key events
Market structure provides a framework for interpreting swings, highs, lows and changes in directional behavior. A market structure indicator may identify events such as a break of structure, often abbreviated as BOS, or a change of character, commonly abbreviated as CHoCH. These labels can help organize the chart, but they should be read in relation to the surrounding price action and selected timeframe.
The useful question is not simply whether a structure label has appeared. It is whether the event changes the way the chart should be understood. A potential break may carry different significance depending on whether it occurs within a larger directional move, near an important swing area or during a period of less decisive price action.
Structure is a map, not a complete decision rule
Structure tools can help traders identify areas that deserve attention, but they do not remove interpretation. Consider the size of the move, the timeframe, the prior sequence of highs and lows, and whether momentum supports the structural observation. This approach is more useful than reacting to every label as though it were a standalone signal.
Some dashboards also display Fibonacci projections or other chart references. These may help traders frame possible areas of interest, but they should remain reference points. A projection is not a promise that price will reach a particular level.
4. Examine institutional activity and smart money context
After reviewing trend, momentum and structure, examine the dashboard’s smart money and institutional activity observations. These features are intended to help traders consider market flow and participation alongside conventional technical analysis. They can add another layer to chart review, particularly when a trader wants to understand whether different dashboard readings are pointing toward a similar market condition.
However, terms such as “smart money” and “institutional activity” should not be treated as proof of what every market participant is doing. Indicator-based observations are analytical references, not direct access to the intentions or positions of specific institutions. The most responsible use is to compare these observations with trend, momentum and structure rather than allowing one dashboard panel to dominate the entire review.
Look for alignment, not a single decisive label
Suppose the trend is positive, momentum is supportive and structure has recently developed in the same direction. A smart money or flow observation that is consistent with those conditions may strengthen the case for continued study. If the readings conflict, the conflict should be recorded rather than ignored. Mixed context may indicate a transition, a range or a chart that does not yet offer a clear analytical framework.
5. Use multi-timeframe analysis to resolve context
Multi-timeframe analysis helps traders distinguish broader context from shorter-term movement. A dashboard that presents several timeframe readings can reduce the need to switch between separate chart views, although it does not replace the need to inspect the chart itself.
One practical approach is to classify observations into three layers: the higher-timeframe environment, the working timeframe and the lower-timeframe detail. The higher timeframe can provide directional background. The working timeframe can show the structure relevant to the current analysis. The lower timeframe can reveal shorter-term momentum or recent changes. The exact choice depends on the trader’s method and is not a universal rule.
| Review layer | Primary purpose | Example question |
|---|---|---|
| Higher timeframe | Establish broad context | What type of market environment has been developing? |
| Working timeframe | Study relevant structure and momentum | Are current swings aligned with the broader context? |
| Lower timeframe | Inspect recent movement | Is the latest change supporting or challenging the working view? |
When timeframes disagree, avoid forcing them into a single conclusion. The disagreement may be the most important finding from the review. It can encourage patience, additional chart study or a decision not to treat the conditions as sufficiently clear.
6. Consider volatility-based reference levels
Some smart money indicator tools include volatility-based target and risk reference levels. These features can help traders visualize how a potential setup might relate to recent price movement and available chart space. They are useful for planning questions, such as whether a proposed reference level is close to nearby structure or whether expected movement appears limited by another area of interest.
These levels should not be confused with guaranteed targets, fixed outcomes or personal risk guidance. Volatility changes, market conditions evolve and a reference generated by an indicator cannot determine whether a trade is suitable for an individual trader. It is better to treat these levels as part of a broader planning process that includes position sizing, invalidation logic and the trader’s own risk rules.
A practical dashboard review sequence
Traders can turn the ideas above into a short, repeatable checklist. The goal is not to create a rigid formula, but to make the review less reactive and easier to document.
- Identify the chart, timeframe and market condition being examined.
- Review the broad trend and note whether the direction is clear or mixed.
- Check momentum for continuation, weakening or transition.
- Inspect market structure, including relevant swings and BOS or CHoCH observations.
- Compare smart money, flow and institutional activity references with the earlier findings.
- Review higher- and lower-timeframe readings for agreement or conflict.
- Mark volatility-based reference levels only as planning aids.
- Write down what would support the current interpretation and what would challenge it.
This process can be used before a trader studies a potential setup in greater detail. It also creates a record of why a chart appeared interesting or why its conditions were considered unclear. That record can be more valuable than relying on memory after the chart changes.
Common mistakes when reading a smart money dashboard
Starting with the most exciting signal
A sudden momentum shift or structure label can attract immediate attention. Starting with it may cause the trader to overlook the broader trend or the significance of the timeframe. Begin with context before examining individual events.
Confusing more information with more certainty
A dashboard can present many readings, but additional panels do not guarantee a clearer conclusion. If trend, momentum, structure and flow observations disagree, the correct response may be to acknowledge uncertainty rather than search for a forced answer.
Using the tool without reviewing the chart
Dashboard summaries are useful, but chart analysis still benefits from viewing price movement, swings and nearby levels directly. Labels and readings should support chart review, not replace it.
Expecting an indicator to make the decision
A TradingView indicator can organize technical information and highlight conditions for further study. It cannot know a trader’s objectives, risk tolerance or complete decision process. The final interpretation remains the trader’s responsibility.
How AKMelytics can support a structured review
AKMelytics – Smart Money Indicator is a TradingView technical analysis tool designed to combine momentum, trend analysis, market structure, market flow, relative strength and smart money concepts. Its dashboard and multi-timeframe features are intended to help traders organize market observations in one analytical workspace.
The tool also includes features related to BOS and CHoCH events, Fibonacci projections, volatility-based target and risk reference levels, and configurable TradingView alerts. These features can support a structured review of potential trading setups, but they should be used as analytical assistance rather than financial advice or a guarantee of results.
Final perspective
The best place to begin with a smart money indicator dashboard is usually not the most detailed signal. Start with the broad trend, then examine momentum, market structure, smart money observations and multi-timeframe alignment. Finish by considering reference levels and the conditions that would support or challenge the interpretation.
This order keeps the dashboard in its proper role: a tool for organizing technical observations and supporting decision-making. It does not eliminate uncertainty, and it should not be treated as a substitute for a trader’s own analysis, risk process or judgment.
Frequently asked questions
What is a smart money indicator?
A smart money indicator is a technical analysis tool that can organize observations related to market structure, flow, institutional activity and smart money concepts. It is designed to support chart analysis, not guarantee a market outcome.
What should I review first on a smart money dashboard?
Start with the broad trend and timeframe context. Then review momentum, market structure, smart money or flow observations, and finally volatility-based reference levels.
How does a market structure indicator help?
A market structure indicator can highlight relevant swing behavior and events such as BOS or CHoCH. These references help frame the chart, but they still need to be interpreted alongside price action and timeframe context.
Can a momentum indicator confirm a trade by itself?
No. Momentum can show strength, weakness or a change in pace, but it does not provide a complete decision framework by itself. It is more useful when compared with trend and market structure.
Why do multiple timeframes sometimes disagree?
Different timeframes describe different layers of price movement. A short-term rise can occur inside a broader decline, so disagreement may reflect the market’s current complexity rather than an error in the dashboard.
Does a smart money indicator guarantee profitable trades?
No. An indicator cannot guarantee profits or eliminate losses. It provides analytical references that traders must evaluate within their own process and risk controls.


Recent Comments