
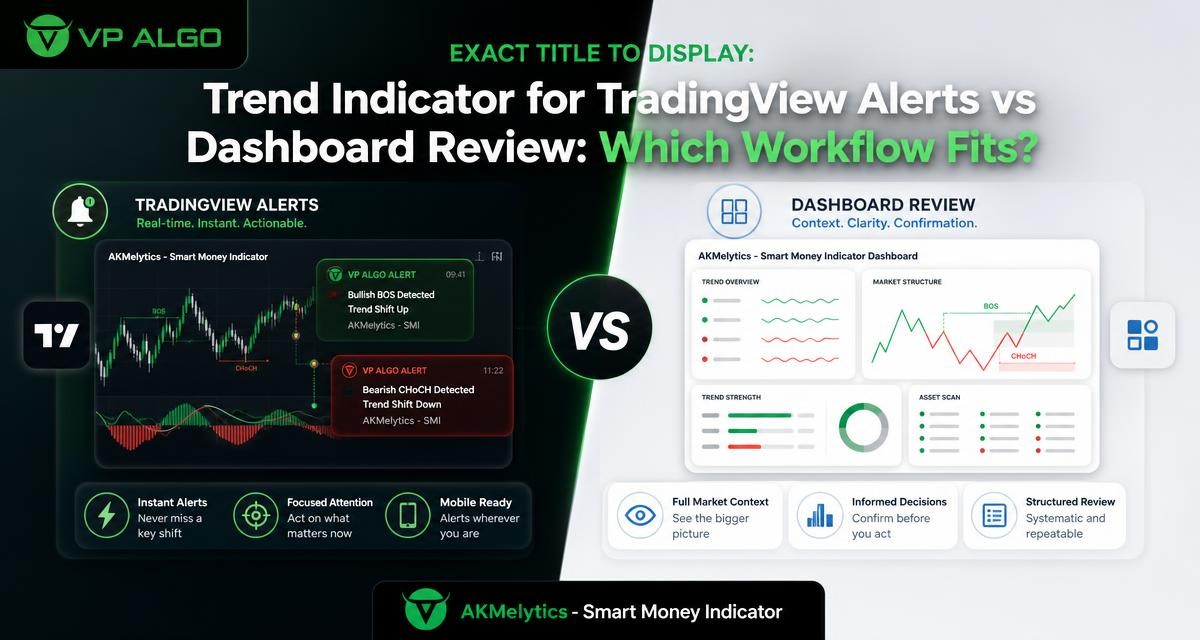
A trend indicator for TradingView can support more than a quick directional reading. Depending on how it is used, it may help traders monitor changing conditions through alerts, review several factors on a dashboard, or combine both approaches. The better workflow depends on how much attention you can give the chart, how much context you need before reviewing a setup, and how deliberately you apply human interpretation.
Alerts and dashboards solve different monitoring problems
TradingView indicator alerts and dashboard reviews are not competing versions of the same task. They bring information to the trader in different ways. An alert-led workflow is designed to draw attention when a configured condition occurs. A dashboard-based workflow is designed to gather several readings in one place so the trader can study the broader market picture.
That distinction matters because a notification can improve awareness without explaining the full situation. Conversely, a dashboard can provide useful context but may require the trader to look at the chart regularly. A practical comparison should therefore focus on attention, context and interpretation rather than assuming that one method is automatically better.
| Workflow | Main strength | What the trader still needs to assess |
|---|---|---|
| Alert-led monitoring | Brings attention to a configured event or condition | Whether the event has enough market context to deserve further review |
| Dashboard-based review | Shows multiple readings together for structured analysis | Whether the trader can review the information consistently and avoid overinterpreting it |
| Combined workflow | Uses alerts for awareness and the dashboard for follow-up analysis | Whether the alert settings and review process match the trader’s own plan |
What an alert-led workflow looks like
With an alert-led workflow, the trader configures TradingView indicator alerts around conditions that deserve attention. The alert may act as a prompt to open a chart, check a timeframe, or review whether a developing situation matches the trader’s criteria. It is best understood as a monitoring aid, not as a complete analysis.
This approach can be useful for traders who cannot watch charts continuously. Rather than scanning every chart at all times, they can use alerts to identify moments for closer review. The benefit is a more focused use of attention. The limitation is that an alert normally highlights a condition, while the decision about what that condition means still requires chart review and judgment.
Where alerts can help
- Reducing constant screen-watching: Alerts can bring a chart back to the trader’s attention when a selected condition is reached.
- Creating a repeatable monitoring routine: A trader can define what should trigger a review instead of relying entirely on memory or random chart checks.
- Supporting multi-timeframe awareness: An alert on one chart can prompt the trader to examine broader or lower-timeframe context before drawing conclusions.
- Prioritising review: When several instruments are being monitored, notifications may help identify which charts require attention first.
The limits of an alert by itself
An alert does not automatically establish that a trend is strong, that momentum will continue, or that a setup is suitable for a particular trading plan. A change in market structure, a momentum reading or a trend condition may be relevant, but the surrounding price action and timeframe still matter.
Alerts can also become distracting when too many conditions are selected. Frequent notifications may encourage reactive decisions, especially when the trader has not defined what to check after receiving one. A useful alert process therefore includes a follow-up checklist: identify the timeframe, review market structure, examine momentum and flow context where available, and decide whether the situation fits the trader’s own rules.
What a dashboard-based review looks like
A dashboard-based workflow starts with observation rather than interruption. The trader opens the chart and reviews a group of readings together. For a tool such as the AKMelytics – Smart Money Indicator, this may include trend analysis, momentum evaluation, market structure, market flow, relative strength, multi-timeframe assessment and smart money concepts.
The value of a dashboard is not simply the number of fields it displays. Its value comes from placing related information in a format that helps the trader ask better questions. Is the apparent trend supported by momentum? Does the market structure agree with the directional reading? Does a lower-timeframe development conflict with the broader context? These questions cannot be answered responsibly by focusing on one label in isolation.
Where dashboard review can help
- Building context: Multiple readings can be reviewed together before the trader decides whether a chart deserves further study.
- Comparing timeframes: Multi-timeframe information can help distinguish a broader directional condition from a shorter-term fluctuation.
- Organising technical observations: Trend, momentum and structure readings can be considered as related parts of one review process.
- Encouraging deliberate analysis: A dashboard invites the trader to inspect conditions rather than responding immediately to a single notification.
The limits of dashboard review
A dashboard does not remove the need for interpretation. Several favourable readings do not guarantee that a trade will work, and conflicting readings do not automatically mean that a market should be ignored. The dashboard provides information for analysis; it does not replace the trader’s process for defining risk, timing, invalidation or position decisions.
Dashboard review also requires consistency. If a trader checks the tool only occasionally, a developing condition may be missed. If the trader watches too many readings at once, the information can become difficult to prioritise. A dashboard works best when the trader knows which observations are primary and which are supporting context.
Attention: when should the workflow interrupt you?
The most obvious difference between alerts and dashboards is how they manage attention. Alerts are interruption-based. They ask the trader to return to a chart after a specified event. Dashboards are inspection-based. They depend on a planned review, either at chosen times or when the trader is already studying a chart.
Neither model is universally suitable. A trader who follows a small watchlist and can review charts regularly may prefer a dashboard-first routine. Someone monitoring several charts while away from the screen may value alerts as a practical way to identify potential changes. The important question is not whether alerts or dashboards are more advanced. It is whether the workflow matches the trader’s available attention.
| Consideration | Alert-led approach | Dashboard-led approach |
|---|---|---|
| Attention | Requests attention after a configured condition | Requires planned or active chart review |
| Speed of awareness | Can highlight a selected event without constant monitoring | Depends on when the trader opens and studies the chart |
| Context at first glance | Usually limited until the chart is reviewed | Places several observations together during review |
| Risk of distraction | May increase with excessive or poorly chosen alerts | May increase when too many readings compete for attention |
| Best use | Prompting a focused follow-up review | Assessing whether conditions align with a trading plan |
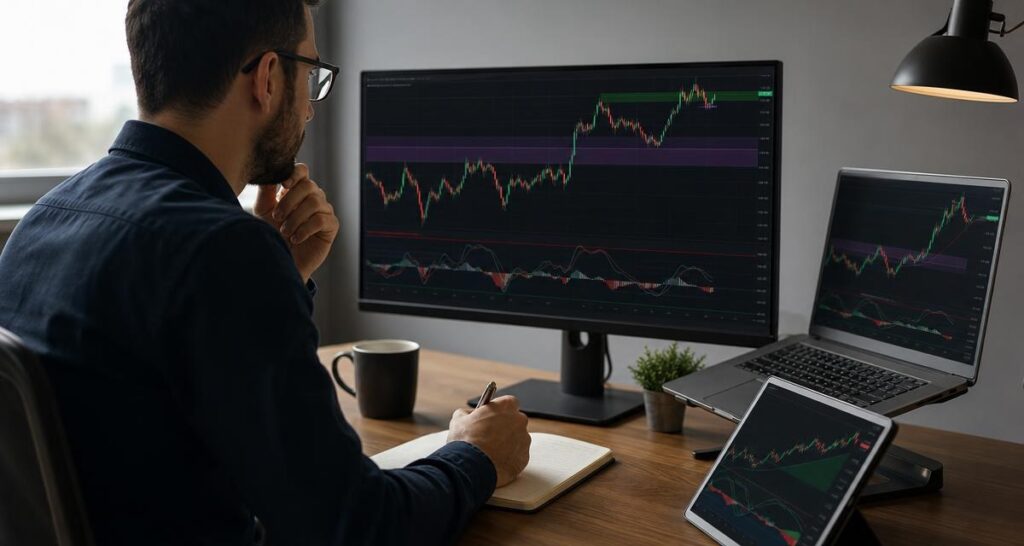
Context: why one trend reading is rarely enough
A trend indicator for TradingView can make directional analysis more structured, but trend should be considered alongside other evidence. A trend reading may describe the current condition on a selected timeframe. It does not, by itself, explain whether momentum is strengthening, whether market structure has changed, or whether a move is consistent with a broader timeframe.
This is where a dashboard can complement alerts. An alert might identify a trend change or another configured condition. The dashboard can then help the trader review momentum, structure, market flow, relative strength and multi-timeframe information before deciding whether the chart merits deeper analysis. The sequence is simple: notice, inspect and interpret.
Trend and momentum
Trend and momentum are related but not identical. A market can show a directional trend while momentum is weakening, or momentum can increase during a move that has not yet changed the broader structure. Reviewing both can help the trader avoid treating a single directional reading as a complete description of market behaviour.
Market structure and smart money concepts
Market structure observations such as break of structure and change of character can add another layer to chart review. In the AKMelytics – Smart Money Indicator, these structure events are included alongside other analysis features. Smart money concepts may also be used as part of the trader’s framework for considering market flow and potential areas of interest.
These concepts still require interpretation in context. A structure event should be reviewed against the timeframe, recent price action and the trader’s own criteria. A label on a chart is an input into analysis, not a guarantee about what price will do next.
Human interpretation remains central
The most useful distinction between alerts and dashboards is not automation versus manual trading. It is prompting versus interpretation. An alert can prompt a review, while a dashboard can organise the information reviewed. Neither one can determine the trader’s objectives, risk tolerance, preferred timeframe or response to uncertainty.
Human interpretation is especially important when readings disagree. For example, a broader trend may point in one direction while a shorter timeframe shows a temporary reversal. Momentum may be improving while market structure remains unresolved. Rather than forcing these observations into a simple buy-or-sell conclusion, the trader can record the conflict and wait for conditions to become clearer according to their own plan.
Use an alert to decide when to look, and use the dashboard to decide what deserves closer thought.
When a combined workflow may fit best
Many traders do not need to choose one method exclusively. A combined workflow can use TradingView indicator alerts for awareness and dashboard review for context. The alert is the starting point; the dashboard and chart are the follow-up tools.
For example, a trader might configure an alert around a relevant trend, momentum or structure condition. When the notification arrives, the trader can open the chart and review the dashboard across the selected timeframes. The next step is not an automatic trade. It is a structured assessment of whether the conditions agree with the trader’s existing rules.
A practical review sequence
- Confirm the alert: Identify exactly which condition caused the notification and which timeframe produced it.
- Review broader context: Check whether the wider trend and higher-timeframe observations support, oppose or complicate the alert.
- Examine structure: Review relevant break of structure or change of character information, where available.
- Assess momentum and flow: Consider whether momentum, market flow and relative strength provide supporting or conflicting information.
- Check the chart itself: Look at price action rather than relying only on dashboard labels or notifications.
- Apply personal rules: Decide whether the situation fits the trader’s documented process, including risk and invalidation considerations.
- Record the reasoning: A brief journal note can show whether the alert was useful and whether the review process needs adjustment.
How to choose the workflow that fits your routine
Start with your actual schedule rather than the features you find most appealing. If you cannot watch TradingView continuously, alerts may be useful for bringing selected conditions to your attention. If you already have dedicated review periods, a dashboard may provide a more organised way to compare trend, momentum and structure.
Next, consider your tolerance for notifications. Some traders prefer a short list of high-priority prompts. Others may want more frequent reminders and are comfortable filtering them manually. The right setting depends on the trader’s process. More alerts do not necessarily create more useful information.
Finally, consider how much context you require before making a decision. If you often act on isolated signals, a dashboard-led review may encourage a more complete assessment. If you spend too long scanning charts and miss relevant changes, carefully selected alerts may improve the transition from observation to review.
| If your main challenge is… | Consider starting with… | Keep in mind |
|---|---|---|
| Missing conditions while away from the chart | A focused alert workflow | Every alert should lead to chart and context review |
| Acting on isolated signals | A dashboard-first workflow | Multiple readings still require interpretation |
| Following several timeframes | A combined workflow | Define which timeframe is for context and which is for detailed review |
| Feeling overwhelmed by notifications | A smaller, prioritised alert set | Remove alerts that do not change your review process |
| Inconsistent chart analysis | A repeatable dashboard checklist | Keep the checklist aligned with your own trading plan |
How the AKMelytics – Smart Money Indicator can fit this comparison
The AKMelytics – Smart Money Indicator is a TradingView technical analysis tool with features related to trend analysis, momentum, market structure, market flow, relative strength and smart money concepts. It also includes multi-timeframe analysis, break of structure and change of character events, Fibonacci projections, volatility-based target and risk reference levels, dashboard context and configurable TradingView alerts.
That combination allows traders to consider both sides of the workflow. Configurable alerts can help identify when a chosen condition deserves attention, while the dashboard can support a broader review after the chart is opened. The tool is intended to support analysis of potential trading setups and decision-making. It does not provide financial advice or guarantee results, so the trader remains responsible for interpretation and decisions.
A balanced way to use trend tools
The strongest workflow is usually the one that creates a clear handoff between detection and analysis. Alerts can help with detection, particularly when constant chart monitoring is impractical. Dashboards can help with analysis by bringing trend, momentum, structure and related observations into one review.
For a trend indicator for TradingView, the goal should not be to turn every notification into a decision. Instead, use the notification to begin a disciplined review. Confirm the condition, study the context, compare timeframes and apply your own rules. This approach keeps the technology useful without treating it as a substitute for judgment.
Frequently asked questions
What is a trend indicator for TradingView?
A trend indicator for TradingView is a chart-based tool that helps traders evaluate directional market conditions. Its readings should be considered alongside price action, timeframe and the trader’s own analysis process.
Are TradingView indicator alerts better than a dashboard?
Neither is automatically better. Alerts can help bring selected conditions to your attention, while a dashboard can help you review several forms of context together. The better choice depends on your schedule and workflow.
Can an alert be treated as a complete trading signal?
An alert is better treated as a prompt for review. It may identify a configured condition, but it does not establish that a setup is suitable, that a trend will continue or that a trade will produce a particular result.
What should I review after receiving an alert?
Confirm the triggering condition and timeframe, then review broader trend context, momentum, market structure, market flow and the chart itself. Apply your own rules before making any decision.
Why is multi-timeframe analysis useful in this workflow?
Different timeframes can show different parts of market behaviour. Reviewing them together may help distinguish a broader trend from a shorter-term movement, although the trader still needs to interpret any disagreement.
Does the AKMelytics – Smart Money Indicator provide financial advice?
No. It is a TradingView technical analysis tool intended to support analysis of potential trading setups and decision-making. It is not a financial adviser and does not guarantee trading results.
Should I use every available alert and dashboard feature?
No. Select the features that support your process and remove information that creates distraction. A smaller, well-understood workflow is often easier to review consistently than a crowded one.


Recent Comments