
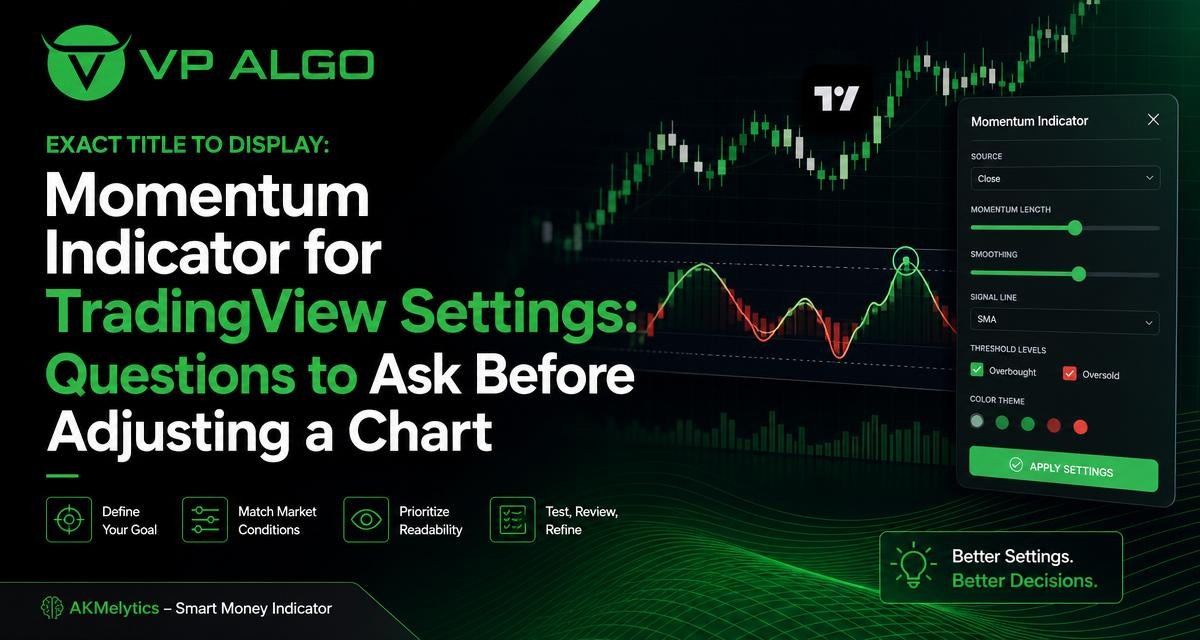
Adjusting a momentum indicator for TradingView can make a chart feel more responsive, but a faster or more sensitive display is not automatically a better one. Before changing settings, consider what you want the indicator to explain, which timeframe you are analysing and whether the new configuration improves your decision-making process. A structured review is especially useful when an indicator combines momentum with trend, market structure, market flow and smart money concepts.
Why indicator settings deserve a clear purpose
Most TradingView indicators contain configurable inputs because traders study different instruments, timeframes and market conditions. Those choices can affect how often a signal appears, how much market movement is filtered out and how easily the chart can be read. The setting itself is not a trading decision; it is part of the analytical framework you use to interpret price action.
A common mistake is to adjust an indicator after a small number of disappointing signals. That approach can lead to repeated changes without a consistent test. Instead, begin with a practical question: what problem are you trying to solve? You may be trying to reduce visual noise, identify stronger momentum shifts, compare multiple timeframes or make alerts easier to manage.
- Are you looking for a broad view of directional momentum?
- Do you need earlier indications of a possible change in market behaviour?
- Is the chart too crowded to distinguish important information?
- Are you analysing momentum together with trend and market structure?
- Do you want the same settings for every chart, or a deliberate configuration for a particular analytical workflow?
Questions to ask before changing a momentum indicator for TradingView
1. What analytical job should the indicator perform?
Momentum can be used in several ways. It may help you assess whether price movement is strengthening, weakening or moving against the broader trend. It may also be used as one part of a wider review that includes market structure, relative strength, trend direction and potential institutional activity. These are different jobs, so the preferred configuration may not be the same for each one.
Write down the role you expect the indicator to play before opening the settings panel. For example, you may want it to provide context rather than a standalone entry trigger. You may want to compare momentum with a break of structure, a change of character or a multi-timeframe trend assessment. Defining the role first makes it easier to judge whether a setting change is useful.
2. Is the chart showing too much noise or too little information?
A more sensitive configuration can respond to smaller price movements. That may make changes appear earlier, but it can also create more fluctuations that require interpretation. A less sensitive configuration may produce a smoother view, although some shorter-term movement may not be displayed as prominently.
There is no universal setting that removes this trade-off. The better choice depends on your analytical objective and tolerance for visual changes. If the chart is difficult to read, simplify the display before making it more reactive. Consider whether every plotted element is necessary and whether a dashboard, label or alert is duplicating information already visible elsewhere.
| Configuration question | What to observe | Why it matters |
|---|---|---|
| Does the indicator react too quickly? | Frequent changes during relatively small price movements | A highly reactive display may require more filtering and interpretation |
| Does the indicator react too slowly? | Momentum changes appear only after a larger move | Important context may arrive later than expected |
| Is the chart crowded? | Labels, lines and signals compete for attention | Visual complexity can make the main analytical question harder to answer |
| Are alerts easy to understand? | Notifications arrive without clear context | An alert is more useful when its condition and timeframe are clear |
3. Which timeframe is the setting intended to support?
Momentum often looks different when viewed on a short-term chart compared with a higher-timeframe chart. A configuration that helps you study local price movement may not provide the same type of context on a broader chart. Before adjusting inputs, decide whether the indicator is supporting a single timeframe or a multi-timeframe process.
If you use more than one timeframe, document what each chart is meant to show. A higher timeframe may provide directional context, while a lower timeframe may help you examine more detailed changes in momentum or market structure. The important point is to avoid comparing signals without considering the timeframe from which they originate.
4. Are you changing the setting because of a repeatable need?
Settings should respond to a defined analytical requirement, not simply to the most recent chart outcome. A single missed move or unexpected signal does not establish that a configuration is unsuitable. Review a broader sample of charts and ask whether the same issue appears repeatedly.
Keep a short record of the original configuration, the reason for the change and what you observed afterward. This does not predict future outcomes, but it can help you avoid making several changes at once. If you alter multiple inputs simultaneously, it becomes difficult to identify which change affected chart readability or signal frequency.
5. What does the momentum reading mean in relation to market structure?
Momentum should not be viewed in isolation when your analytical process also considers structure. A momentum shift may occur before, during or after a visible change in market structure. The relationship between those observations can be more informative than either display on its own.
For example, you might examine whether a momentum change appears alongside a break of structure or a change of character. You might also ask whether the broader trend supports or conflicts with the momentum reading. This approach keeps the indicator in its proper role: a tool for analysing market conditions rather than an automatic conclusion about what price will do next.
How chart readability affects configuration choices
A useful TradingView indicator should be understandable on the chart where you use it. Readability includes more than colour selection. It also involves the number of plotted elements, the placement of labels, the distinction between current and historical information and the amount of attention required to interpret the display.
When a chart becomes crowded, start with the visual hierarchy. Identify the information you need most often, then reduce or hide elements that are not relevant to the current analytical task. If a tool includes trend analysis, momentum signals, market structure, market flow and dashboard context, you may not need every component visible at the same time.
Separate context from decision points
Context helps you understand the environment around a possible setup. Decision points are the specific observations that cause you to continue analysing, wait or reject an idea. Keeping those categories separate can make a complex indicator easier to use.
- Context: broader trend direction, multi-timeframe assessment and general market flow.
- Structure: events such as breaks of structure or changes of character.
- Momentum: indications that movement may be strengthening or weakening.
- Reference levels: chart information such as Fibonacci projections or volatility-based target and risk reference levels.
- Alerts: configurable notifications that draw attention to a defined condition.
This separation does not turn any component into a guaranteed signal. It simply gives each part a defined place in the review process and can reduce the temptation to treat every visual event as equally important.
Questions about alerts and notifications
Configurable TradingView alerts can be useful when you already understand the condition being monitored. Before enabling an alert, ask what it represents, which timeframe it uses and what action you intend to take when it appears. If the answer is unclear, adding more notifications may increase distraction rather than improve analysis.
It is also worth checking whether several alerts describe closely related events. Multiple notifications for momentum, structure and trend may arrive near one another. A simple naming convention can help you distinguish the indicator, timeframe and condition involved. Review alert settings after changing the indicator so that your notifications still match your analytical process.
Evaluating a multi-feature TradingView indicator
A multi-feature tool may combine several analytical perspectives in one interface. The AKMelytics – Smart Money Indicator is described as a TradingView technical analysis tool combining momentum, trend analysis, market structure, market flow, relative strength and smart money concepts. Its listed features also include multi-timeframe analysis, break of structure and change of character events, Fibonacci projections, volatility-based target and risk reference levels, dashboard context and configurable TradingView alerts.
With a tool of this type, the main configuration question is not simply whether the momentum component should be faster or slower. You should also ask how the components relate to one another. Are you using the momentum view to add context to structure? Are the dashboard elements helping you review the chart, or are they adding information you do not currently need? Can you explain each enabled component in plain language?
A practical review sequence
- Define the market question you want the chart to help you examine.
- Select the timeframe or timeframes relevant to that question.
- Review the indicator with its existing configuration before making changes.
- Identify one specific issue, such as excessive noise or insufficient context.
- Change one setting or one visual group at a time.
- Observe whether the change improves interpretation without treating it as proof of future performance.
- Record the configuration and retain only changes that support a repeatable workflow.
What not to assume from a changed setting
Changing a parameter does not make an indicator more accurate in every market condition. It also does not remove uncertainty, guarantee a profitable result or eliminate losses. A setting can alter how information is displayed without changing the underlying behaviour of the market.
Be cautious with conclusions based on a small number of examples. A configuration that appears helpful on one chart or during one period may not provide the same experience elsewhere. Historical observations can support a review of your process, but they do not guarantee future results. The indicator should be used for educational and trading-decision assistance purposes, not as financial advice.
When a TradingView indicator may be worth considering
A multi-feature TradingView indicator may be relevant if you want a structured way to examine momentum alongside trend, market structure, institutional flow and smart money conditions. It may also suit traders who prefer configurable dashboards, multi-timeframe context and alerts within their charting workflow.
Before choosing any tool, confirm that its features match your needs and that you understand how to configure and interpret them. VP ALGO TRADING develops and sells TradingView indicators and algorithmic trading tools. The company provides the Delphi Intelligence Smart Money Indicator for TradingView, while the AKMelytics – Smart Money Indicator is described with the feature set above. Product access, installation and activation questions can be directed to the company through its available support process. Customers are instructed to provide their TradingView ID by email after purchase for product access.
A final checklist before saving new settings
- Have you identified the specific analytical problem the change should address?
- Is the selected timeframe appropriate for the question you are asking?
- Can you explain what each enabled component contributes?
- Has the chart become easier to read rather than simply more active?
- Do the alerts correspond to conditions you can interpret?
- Have you changed only one meaningful variable at a time?
- Are you avoiding conclusions about guaranteed results or future performance?
The best configuration is usually the one that supports a consistent and understandable review process. Treat a momentum indicator for TradingView as one analytical input among several, then assess how its momentum, trend and structure information fits together. Thoughtful configuration will not remove market uncertainty, but it can help you work with a clearer chart and a more disciplined set of questions.
Frequently asked questions
What is a momentum indicator for TradingView?
It is a TradingView tool that helps users examine the strength or direction of price movement. Depending on the indicator, momentum may be presented alongside trend, market structure, relative strength, market flow or other analytical information.
Should I use faster settings to receive earlier signals?
Faster settings may make the display more responsive to smaller price movements, but they can also show more fluctuations. Choose settings according to your analytical purpose rather than assuming that earlier information is automatically better.
How should momentum be used with market structure?
Review whether a momentum change supports, conflicts with or occurs separately from structural events such as a break of structure or change of character. This provides context without treating momentum as a standalone trading decision.
Can one setting work across every timeframe?
Not necessarily. Different timeframes present different levels of price detail and market context. If you use multiple timeframes, define the role of each chart and review whether the configuration remains readable and relevant.
What should I do if my TradingView chart is too crowded?
Identify the information you need most, then hide or reduce elements that do not support the current analytical question. A simpler display can be more useful than showing every available feature at once.
Can an indicator guarantee profitable trading results?
No. An indicator can support analysis and decision-making, but it cannot guarantee profits, eliminate losses or predict future market behaviour. Use it as part of a broader process and remain aware of market uncertainty.
What is the AKMelytics – Smart Money Indicator?
It is a TradingView technical analysis tool described as combining momentum, trend analysis, market structure, market flow, relative strength and smart money concepts. It also includes features such as multi-timeframe analysis, structure events, reference levels, dashboard context and configurable alerts.


Recent Comments