
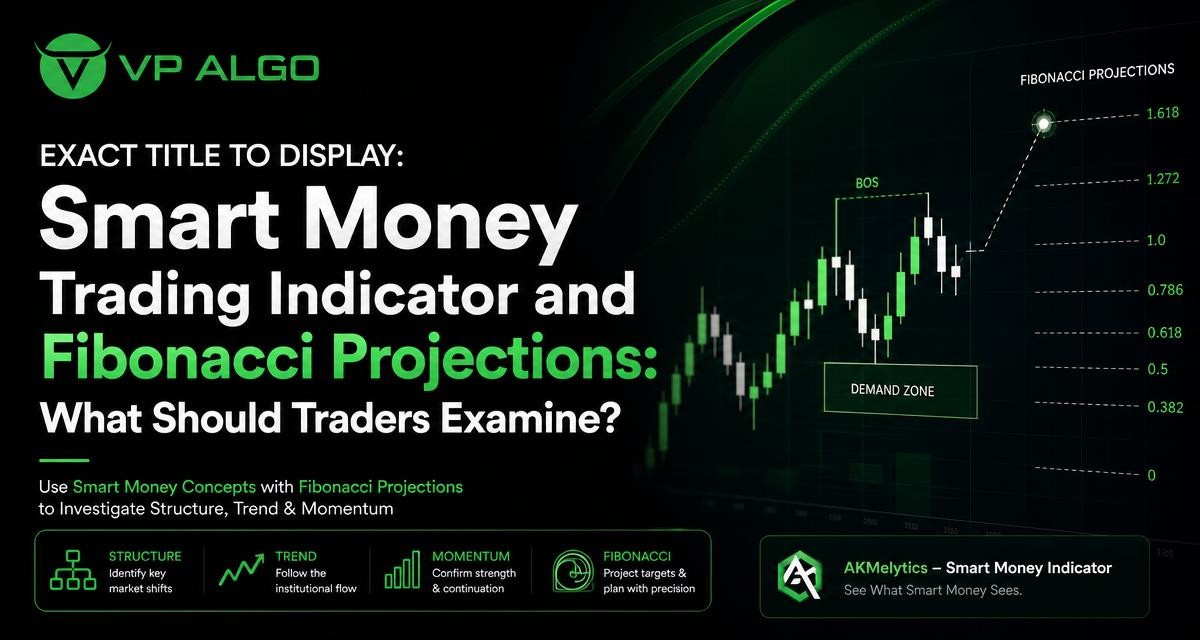
A smart money trading indicator can help organise several areas of technical analysis on one chart, but no single reading should be treated as a complete trading decision. Fibonacci projections are most useful when they are examined as reference levels alongside market structure, trend direction, momentum and other evidence. This approach can help traders investigate a potential setup more methodically instead of relying on one projected price level.
What a smart money trading indicator is designed to examine
Smart money concepts generally focus on how price structure, directional pressure and possible institutional activity may appear on a chart. In practice, traders often study swing points, breaks of structure, changes in character, momentum behaviour and the relationship between price and important areas of interest. An indicator can bring some of these observations together so the trader has a more consistent framework for reviewing the chart.
The AKMelytics – Smart Money Indicator is a TradingView technical analysis tool that combines elements related to momentum, trend analysis, market structure, market flow, relative strength and smart money concepts. Its features include multi-timeframe analysis, BOS and CHoCH structure events, Fibonacci projections, volatility-based target and risk reference levels, dashboard context and configurable TradingView alerts.
These features are best viewed as analytical aids. They can help a trader ask better questions about a chart, but they do not remove the need to interpret price action, assess uncertainty and apply personal risk controls. The indicator is intended to support analysis and decision-making, not to provide financial advice or guarantee a particular result.
Why Fibonacci projections need market context
Fibonacci projections extend a price movement to estimate possible areas where a continuation move could encounter interest. They differ from simple retracement tools because they are commonly used to project levels beyond a prior swing. This makes them relevant when traders are investigating where a directional move might pause, react or require a fresh assessment.
A projected level does not explain why price should reach it or reverse there. Its usefulness depends on the quality of the swing points selected and the surrounding market conditions. A projection drawn from unclear or constantly changing structure may produce levels that look precise but have limited analytical value.
For that reason, traders should treat Fibonacci projections as reference points rather than automatic targets. A projected level becomes more meaningful when it agrees with observations such as a clear break of structure, a sustained trend, supportive momentum or a broader area where price has previously reacted.
Five areas to examine before relying on a projection
1. Market structure
Start by asking what the market is currently doing structurally. Is price forming higher highs and higher lows, lower highs and lower lows, or a less consistent range? The answer provides the first layer of context for any projection.
A break of structure, often abbreviated as BOS, may indicate that price has moved beyond a previously important swing. A change of character, or CHoCH, can draw attention to a possible change in the prior directional behaviour. Neither event should automatically be treated as confirmation of a trade. The trader still needs to examine whether the break is clear, whether it occurs within a meaningful trend and whether momentum supports the move.
2. Trend direction across timeframes
A projection on a short-term chart may point in a different direction from the dominant movement on a higher timeframe. This does not make the shorter-term observation useless, but it changes how the chart should be interpreted. A short-term upward move may be a temporary reaction within a broader decline, while a pullback on a lower timeframe may occur during a larger upward trend.
Multi-timeframe analysis can help separate these possibilities. Before examining a projected level, compare the broader trend with the timeframe being used for the setup. A smart money trading indicator that includes multi-timeframe trend assessment can make this review more structured, although the displayed context still requires human interpretation.
3. Momentum and relative strength
Momentum helps traders consider whether price movement has supporting force or is beginning to lose energy. Strong movement toward a projected level may suggest continuation is still being investigated, while weakening momentum can prompt closer attention to possible hesitation or a pullback.
Momentum should not be read in isolation. A market can remain strong while a momentum measure temporarily weakens, and a sharp movement can occur without creating a durable trend. Compare momentum observations with the structure and trend on the chart. When the three areas disagree, the disagreement itself is useful information because it indicates greater uncertainty.
4. The quality of the swing points
Fibonacci projections depend heavily on the swing high, swing low and relevant impulse or corrective movement chosen for the calculation. If those points are not clear, several different projections may be drawn from the same chart, each producing different reference levels.
Review whether the selected swings are visible within the current structure and whether they represent a meaningful movement rather than a minor fluctuation. Avoid giving extra significance to a projection simply because its levels appear neatly spaced. The underlying price movement matters more than the appearance of the tool.
5. Volatility and risk reference levels
Projected price levels should be considered together with the market’s volatility. A level that appears close on the chart may be less useful when normal price movement is wide. Conversely, a narrow movement can make a nearby level more relevant to the current investigation.
The AKMelytics – Smart Money Indicator includes volatility-based target and risk reference levels. These references can help traders think about the distance between a potential area of interest and the amount of movement that may occur before the original idea needs to be reconsidered. They are not guarantees, fixed instructions or substitutes for a personal risk-management process.
How to combine Fibonacci projections with smart money concepts
A practical review can begin with structure and move toward projection rather than starting with a number. First, identify the current directional condition and the most relevant swing points. Next, review whether a BOS or CHoCH event provides useful structural context. Then examine the trend and momentum readings across the chosen timeframes.
Only after that should Fibonacci projections be used to mark possible areas for further investigation. The projected level may be more interesting when it aligns with a broader structural observation, but alignment does not turn the level into a certainty. The purpose is to create a disciplined checklist for analysis.
| Area to examine | Question for the trader | Why it matters |
|---|---|---|
| Structure | Has price confirmed a meaningful break or change? | Helps define the current market condition. |
| Trend | Does the selected timeframe agree with the broader direction? | Places the setup in a wider context. |
| Momentum | Is price movement strengthening, weakening or mixed? | Shows whether directional pressure deserves closer review. |
| Swing selection | Are the Fibonacci anchor points clear and relevant? | Improves the quality of the projection being studied. |
| Volatility | Is the projected distance realistic for current movement? | Helps frame uncertainty and risk references. |
| Alerts and dashboard | Can the chart context be monitored consistently? | Supports an organised review without replacing judgment. |
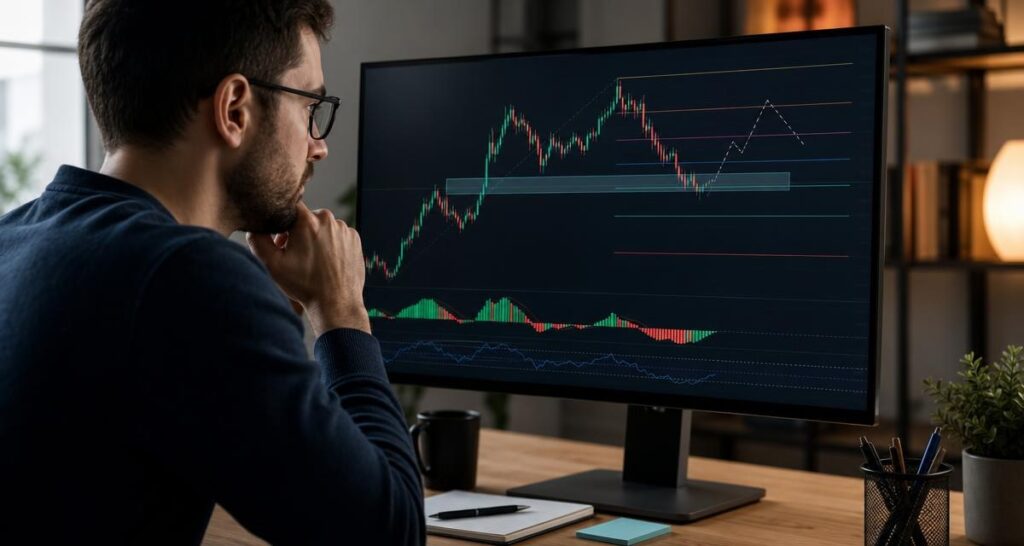
A step-by-step chart review process
Begin with the broader chart condition
Before focusing on a projected level, identify whether the market appears directional, corrective or unclear. Note the major swing points and observe how price has behaved around them. If the chart is congested or contradictory, record that uncertainty instead of forcing a directional interpretation.
Review structure events
Look for BOS and CHoCH events in relation to the surrounding price action. Consider whether the event follows a sustained movement or is simply a short-lived move through a nearby swing. The location and sequence of the event can be as important as the event label itself.
Check trend and momentum alignment
Compare the trend assessment on the selected timeframe with the broader timeframe context. Then review momentum and relative strength. When structure, trend and momentum point in a similar direction, the chart may offer a clearer subject for further investigation. When they conflict, reduce the confidence of any single projection and continue assessing the chart.
Mark Fibonacci projections as areas of interest
Use the relevant impulse and swing points to establish the projection. Mark the resulting levels, but avoid interpreting them as guaranteed destinations. Ask whether a projected area is consistent with the structure and whether the market has enough directional pressure to make the level worth monitoring.
Define what would invalidate the idea
A useful analysis includes conditions that would make the original interpretation less relevant. These may involve a failure to hold a structural area, a clear reversal in trend context or momentum behaviour that contradicts the initial view. Defining these conditions in advance can help reduce emotional reinterpretation after price begins moving.
Common mistakes when using Fibonacci projections
Treating a level as a prediction
A Fibonacci projection is a reference, not a promise that price will reach or react at a particular level. Markets can stop short, move through the level or change direction before the projection becomes relevant. Use the level to organise observation rather than to assume an outcome.
Ignoring conflicting timeframes
A lower-timeframe signal can look persuasive while the higher timeframe remains in the opposite condition. This conflict should be visible in the analysis. Multi-timeframe information can improve context, but it does not remove the uncertainty created by different directional readings.
Drawing too many projections
Multiple projections can fill a chart with overlapping levels. Instead of adding every possible calculation, focus on swings that are clearly connected to the current structure. A smaller number of well-understood references is generally easier to evaluate than a crowded collection of lines.
Using alerts as decisions
Configurable TradingView alerts can help traders monitor selected conditions, but an alert is not the same as confirmation or financial advice. When an alert appears, return to the chart and review structure, trend, momentum, volatility and the original reason for monitoring the level.
How the AKMelytics – Smart Money Indicator can support this workflow
The indicator brings several analytical components into a TradingView environment, including trend analysis, momentum signals, market structure events, market flow, relative strength, smart money analysis and Fibonacci projections. A dashboard can provide additional chart context, while multi-timeframe features can support a broader review of directional conditions.
This combination may be useful for traders who want a repeatable way to investigate potential setups. It can reduce the need to switch between separate chart studies while keeping the responsibility for interpretation with the trader. The tool should be used as part of a personal process that includes learning, testing and risk management rather than as an automatic buy-and-sell system.
VP ALGO TRADING develops and sells TradingView indicators and algorithmic trading tools. The company offers a request-based seven-day free trial for its indicator and Telegram channel. After purchase, customers are instructed to provide their TradingView ID by email for product access, and support is available for installation, activation or usage assistance. Trial or purchase details should be confirmed directly with the company.
A balanced checklist for further investigation
- Is the broader market condition directional, corrective or unclear?
- Which swing points are genuinely relevant to the current structure?
- Has a BOS or CHoCH event occurred, and does the surrounding price action support its interpretation?
- Do the selected timeframe and higher timeframe show compatible trend conditions?
- Does momentum support the current movement, or is it showing disagreement?
- Does the Fibonacci projection overlap with a meaningful structural area?
- Are volatility and risk reference levels suitable for the way the chart is being assessed?
- What evidence would make the original interpretation invalid?
This checklist does not produce a guaranteed outcome. Its value is in encouraging the trader to examine several independent aspects of the chart before acting on one attractive level or indicator reading.
Final perspective
Fibonacci projections can be useful within a smart money concepts framework when they are treated as prompts for further investigation. Their strongest role is not to predict a precise destination, but to help traders organise possible areas of interest after reviewing structure, trend, momentum, swing quality and volatility.
A smart money trading indicator such as AKMelytics – Smart Money Indicator can bring these observations together on TradingView through features related to market structure, multi-timeframe trend, momentum, smart money analysis and projected levels. Even so, the chart remains open to interpretation, and no indicator can guarantee profitable results or eliminate trading losses. Careful analysis, clear invalidation conditions and responsible risk management remain essential.
Frequently asked questions
What is a smart money trading indicator?
It is a technical analysis tool that helps traders examine areas such as market structure, trend, momentum, market flow and smart money concepts. It supports chart analysis but does not provide guaranteed outcomes or financial advice.
What are Fibonacci projections used for?
Fibonacci projections are used to identify possible future price areas based on selected swings and an earlier movement. They should be treated as reference levels for investigation rather than fixed predictions.
Should Fibonacci projections be used without market structure?
They can be drawn independently, but their interpretation is usually more informed when considered with structure. BOS, CHoCH, swing quality and the broader price context can help determine whether a projection deserves further attention.
How does momentum affect a projected level?
Momentum provides context about the strength or weakness of the current movement. Strong or weakening momentum may change how closely a trader monitors a projected area, but momentum alone does not confirm a trade.
Can a TradingView indicator make trading decisions automatically?
An indicator can display analytical information and, where supported, configurable alerts. The trader remains responsible for interpreting the chart and deciding how to manage risk. The AKMelytics – Smart Money Indicator is designed to support analysis, not to guarantee results.
What does the AKMelytics – Smart Money Indicator include?
It includes features related to momentum, trend analysis, market structure, market flow, relative strength, smart money concepts, multi-timeframe analysis, BOS and CHoCH events, Fibonacci projections, volatility-based reference levels, dashboard context and TradingView alerts.


Recent Comments