
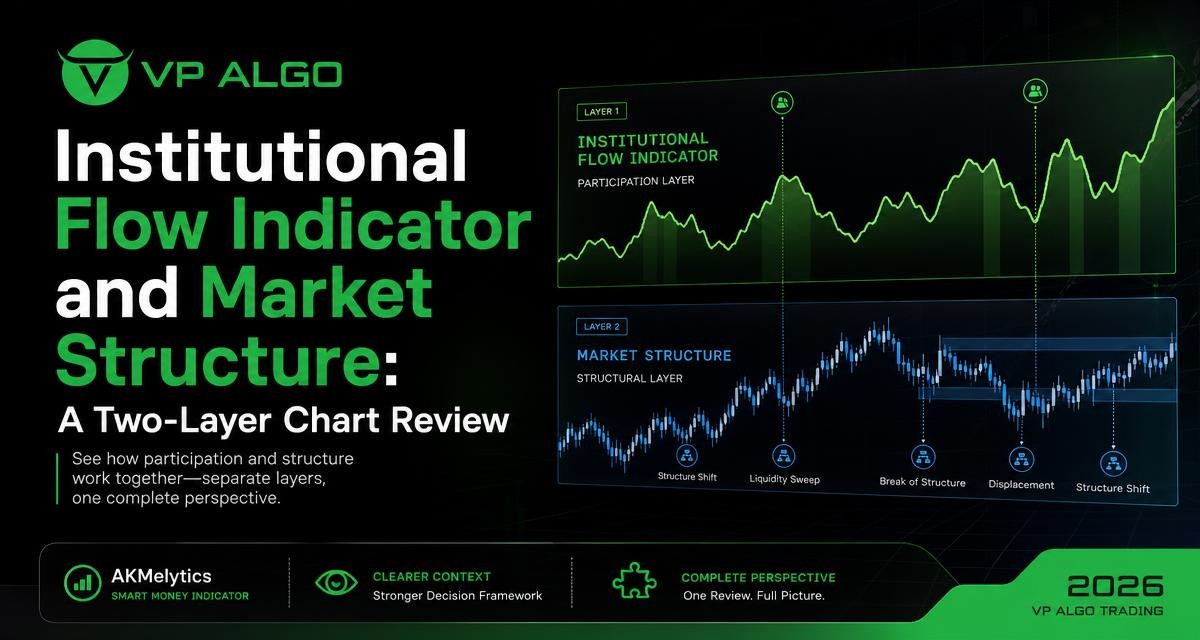
An institutional flow indicator and a market structure indicator can answer different questions on the same chart. One layer helps organize observations related to participation, flow and smart money activity; the other records how price is forming swings, breaking structure or changing character. Reviewing these layers separately can make chart analysis more disciplined and reduce the temptation to treat one signal as a complete trading decision.
Why use two analytical layers?
Charts often contain several types of information at once. Trend tools describe directional conditions, momentum tools show changes in price strength, and structure tools identify events such as a break of structure or a change of character. Participation-related tools add another perspective by helping traders review whether market activity appears aligned with a developing move.
The difficulty is that these observations do not always appear at the same time. A participation-related signal may appear while price is still inside a range. A structural break may occur after a long move has already developed. Separating the observations allows the trader to record what the chart is showing without forcing every feature into a single buy or sell conclusion.
| Analytical layer | Main question | Examples of observations |
|---|---|---|
| Participation and flow | What does the chart suggest about activity or market participation? | Flow context, institutional activity references, relative strength and smart money observations |
| Market structure | How is price organizing its swings? | Higher highs, lower lows, BOS and CHoCH events |
| Context | What conditions surround the observation? | Trend direction, momentum, timeframe and volatility |
| Decision process | What should be reviewed before acting? | Setup location, invalidation, risk reference and confirmation requirements |
This approach does not make a chart certain or remove trading risk. It creates a repeatable way to describe what is visible, what remains unconfirmed and what would invalidate the working interpretation.
What an institutional flow indicator can contribute
The phrase institutional flow indicator is commonly used for tools that help traders examine participation-related conditions through a chart-based framework. It should not automatically be interpreted as direct access to the orders or intentions of a specific institution. In a technical analysis setting, the indicator is better treated as one source of market context that can be compared with price action and structure.
For example, the flow layer may draw attention to activity that appears to support a trend, a change in relative strength or a developing smart money condition. The useful question is not whether the indicator has discovered a guaranteed institutional position. The useful question is whether its observation agrees with the broader chart and deserves further review.
Questions to ask when reviewing flow information
- Is the observation developing in the same direction as the current trend?
- Does price have a clear location, or is the signal appearing in the middle of a noisy range?
- Is momentum supporting the observation, weakening it or remaining unclear?
- Does the market structure confirm a change, or has structure not yet shifted?
- What would make the original interpretation invalid?
These questions help prevent a flow-related label from becoming an isolated trading instruction. They also encourage the trader to distinguish between an early observation and a confirmed structural event.
What a market structure indicator records
A market structure indicator focuses on the arrangement and progression of price swings. It can help a trader identify whether the chart is producing a sequence of higher highs and higher lows, lower highs and lower lows, or a less consistent range. It may also mark structural events such as a break of structure, often abbreviated as BOS, and a change of character, often abbreviated as CHoCH.
Structure is useful because it turns a visual chart impression into a sequence that can be reviewed. Instead of describing price as simply bullish or bearish, a trader can record which swing was broken, on which timeframe, and whether the event occurred near a meaningful area of the chart.
BOS and CHoCH are observations, not standalone verdicts
A break of structure can indicate that price has moved beyond a previously relevant swing. A change of character can draw attention to a possible transition in the way price is moving. Neither event, by itself, proves that a new trend will continue. The quality of the event depends on context, including the timeframe, the surrounding volatility and the location of the broken swing.
When a structure event appears, record it precisely. Note whether it supports the existing directional view or challenges it. Then compare that information with the participation-related layer. This creates a more balanced review than treating every BOS or CHoCH label as an immediate signal.
A practical two-layer chart review
A repeatable process can make the distinction between flow and structure easier to apply. The sequence below is an analytical framework, not a promise of a particular trading result.
Step 1: Establish the broader chart context
Begin with the timeframe and the overall price environment. Is the chart trending, consolidating or moving through a transition? Mark the most relevant swing points and note whether recent price action is orderly or highly uneven. A flow observation has a different meaning when it appears inside a broad range than when it appears during a clearly progressing trend.
If the tool provides multi-timeframe trend context, use it to organize the review rather than to replace the chart itself. A higher-timeframe direction and a lower-timeframe structure event may tell different parts of the same story.
Step 2: Record the participation-related observation
Next, examine the institutional flow indicator or related smart money features. Write down what the tool is showing and when it appeared. Use neutral language such as “participation-related condition is present” or “flow context is aligned with the current direction.” Avoid turning the observation into a claim that a particular institution is buying or selling.
Also consider whether the observation is persistent or isolated. A single chart event may deserve attention, but it should be reviewed alongside trend, momentum and price location before it receives greater weight.
Step 3: Map the current market structure
Move to the structure layer and identify the latest meaningful swing sequence. Note any BOS or CHoCH event, including the price area involved and the timeframe used. Ask whether the event confirms continuation, suggests a possible transition or simply reflects short-term movement inside a larger range.
This step is especially important when the flow layer appears early. A participation-related observation may precede a visible structural change, but the absence of a structure confirmation should remain part of the written review.
Step 4: Compare the layers
| Flow observation | Structure observation | How to describe the chart |
|---|---|---|
| Aligned with the current direction | Structure continues in the same direction | Context and structure are aligned; continue reviewing location and risk conditions |
| Aligned with the current direction | No meaningful structural confirmation | Participation context is present, but the structural case remains incomplete |
| Opposite to the current direction | CHoCH or another transition event appears | Possible change in conditions; assess whether the event holds |
| Unclear or mixed | Price remains inside a range | Evidence is mixed; avoid assigning a strong directional interpretation |
The table is not a scoring system. It is a way to keep the evidence separated. Alignment can support further investigation, while disagreement can be useful because it highlights where the chart needs more confirmation or a longer observation period.
Step 5: Define the review boundary
Before considering any potential setup, identify what would invalidate the current interpretation. This might be a failure to hold a relevant swing, a return into a prior range or a clear loss of momentum. Volatility-based target and risk reference levels may help organize this discussion when they are available in the indicator, but they should be treated as references rather than guarantees.
A written invalidation point improves consistency. It gives the trader a way to revisit the chart later and ask whether the original reasoning still applies, instead of changing the explanation after price has moved.

How the two layers interact in common chart conditions
Flow context appears before a structural break
This situation can attract attention because the participation-related observation appears to anticipate a possible move. The correct response is not to assume that the break must follow. Record the flow condition, identify the nearby swing that would need to break, and wait to see how price behaves around that level.
If the expected structure event does not occur, the flow observation may have been early, temporary or less relevant to the selected timeframe. That is useful information for the review and does not need to be reinterpreted as a failed certainty.
Structure breaks while flow remains mixed
A BOS or CHoCH can occur even when participation-related information is not clearly aligned. In this case, the structural event is real as a chart observation, but its follow-through remains an open question. Check whether the break is occurring at a meaningful location and whether momentum supports continuation.
Mixed evidence does not necessarily mean that the chart is unusable. It means the review should state the uncertainty instead of hiding it behind a single indicator label.
Both layers point in the same direction
When flow context, trend, momentum and structure appear aligned, the chart may deserve a closer review. Even then, alignment is not a guarantee of outcome. A trader still needs to consider timeframe, entry location, invalidation and the possibility that conditions can change.
The value of alignment is mainly organizational: several forms of evidence tell a similar story. It should not be confused with certainty or with financial advice.
Using AKMelytics for a structured TradingView review
AKMelytics – Smart Money Indicator is designed as a TradingView technical analysis tool combining features related to momentum, trend analysis, market structure, market flow, relative strength and smart money concepts. Its feature set also includes multi-timeframe analysis, BOS and CHoCH structure events, Fibonacci projections, volatility-based target and risk reference levels, dashboard context and configurable TradingView alerts.
These features can be organized into the two-layer process described above. Market flow, relative strength and smart money observations can be recorded in the participation and context section of a review. Market structure events can be recorded separately, with the dashboard and multi-timeframe information helping the trader maintain a broader view.
The indicator is intended to support analysis of potential trading setups and decision-making. It does not provide financial advice, remove the need for independent judgment or guarantee results. A trader should use the tool as part of a defined review process rather than treating every alert or plotted event as an instruction to trade.
Common mistakes when combining flow and structure
Calling a proxy direct institutional data
Chart-based flow features can help organize participation-related observations, but they should not be described as proof of a named institution’s orders or intentions. Keeping this distinction clear makes the analysis more accurate and reduces overconfidence.
Using too many timeframes without a hierarchy
Multiple timeframes can add context, but they can also produce conflicting signals. Choose a primary review timeframe, then use higher or lower timeframes for a specific purpose. For example, one timeframe may establish context while another helps examine a structure event.
Treating alerts as confirmation
An alert can make an event easier to notice, but notification is not the same as confirmation. Review the candle, the relevant swing, the surrounding range and the broader trend before deciding what the alert means.
Ignoring location
The same flow observation or structure break can have different importance depending on where it occurs. A move near a clearly watched swing may deserve more attention than an identical label in the middle of a congested range. Location should therefore be recorded alongside the event.
A simple journal template
A two-layer journal does not need to be complicated. The following fields can help traders compare chart reviews over time:
- Instrument and timeframe: Record the chart context without assuming that conclusions transfer automatically to another market or timeframe.
- Trend and momentum: Describe whether directional and momentum conditions are supportive, opposing or unclear.
- Flow observation: Write what the institutional flow indicator or smart money layer is showing in neutral terms.
- Structure event: Record the latest swing, BOS, CHoCH or range condition.
- Agreement or conflict: State whether the two layers align or disagree.
- Invalidation: Define what would make the current interpretation no longer relevant.
- Review outcome: Later, note whether the structure held, failed or remained unresolved without rewriting the original observation.
This process encourages evidence-based review. It also makes it easier to identify whether mistakes came from reading the chart incorrectly, entering without enough confirmation or failing to manage an invalidated idea.
Final perspective
An institutional flow indicator and a market structure indicator are most useful when their roles remain distinct. Flow and smart money features can provide participation-related context, while structure tools describe how price is progressing through swings and key events. Combining them does not create certainty, but it can create a clearer record of what the chart is showing.
For TradingView users, a tool such as AKMelytics can bring these features into one review environment. The strongest practice is still to interpret every observation in context, record uncertainty, define invalidation and treat the indicator as analytical assistance rather than financial advice or a guarantee of results.
Frequently asked questions
What is an institutional flow indicator?
An institutional flow indicator is a chart-based tool used to organize observations related to market participation, flow or smart money conditions. It should not automatically be treated as direct proof of a specific institution’s orders or intentions.
What does a market structure indicator show?
A market structure indicator helps identify price swings and events such as a break of structure or change of character. It can make the progression of price easier to review, but it does not guarantee that a trend will continue.
Should flow context come before market structure?
There is no universal requirement for one to come first. A practical review can record the flow observation and structure separately, then compare them. This helps show whether participation-related context has structural confirmation.
Does a BOS confirm a trading opportunity?
No. A BOS is a structural observation. Its significance depends on factors such as timeframe, location, momentum, volatility and whether price can hold the relevant area.
How should CHoCH be interpreted?
CHoCH can draw attention to a possible change in price behavior. It should be reviewed with the surrounding swing sequence and broader context rather than treated as an automatic reversal signal.
Can AKMelytics provide financial advice?
No. AKMelytics is a TradingView technical analysis tool intended to support analysis of potential setups and trading decisions. It does not provide financial advice or guarantee results.
What is the main benefit of a two-layer chart review?
The main benefit is clarity. Separating participation-related observations from structural events helps traders describe agreement, disagreement and uncertainty without relying on one indicator output as a complete decision.


Recent Comments