
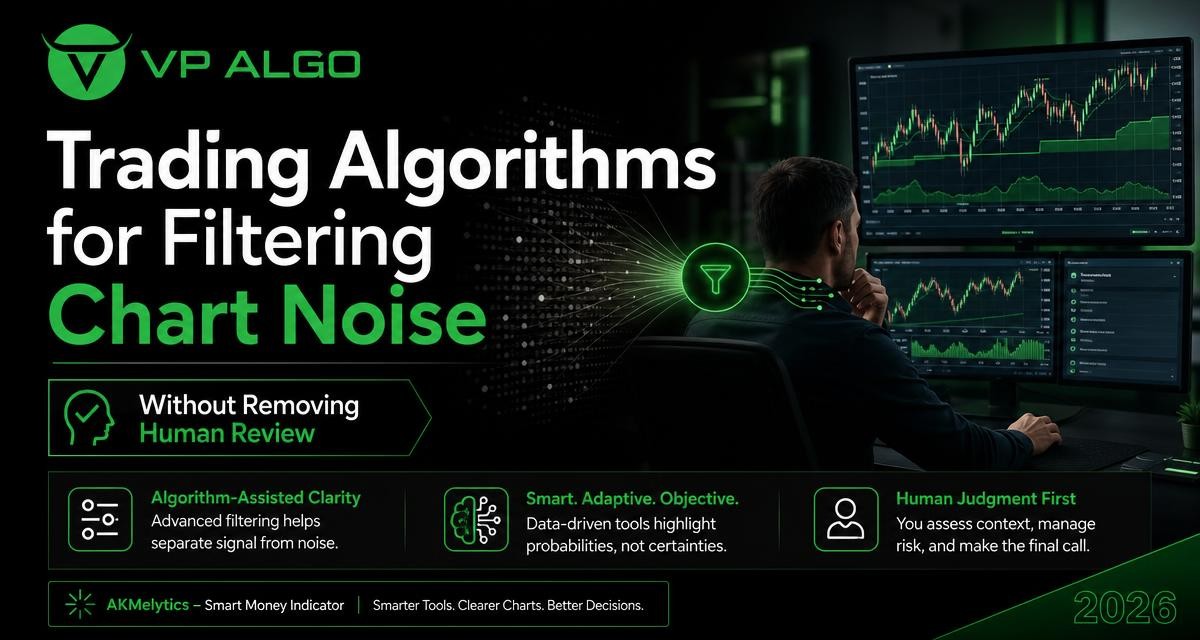
Trading algorithms can help traders organize a crowded chart, but they should not replace the trader’s assessment of context, risk or uncertainty. When an indicator brings together trend, momentum, market structure and smart money information, its most useful role may be to make relevant conditions easier to review rather than to make decisions automatically. This distinction is central to using algorithm-assisted tools responsibly in trading technical analysis.
Why chart noise is difficult to interpret
A price chart contains more information than a trader can always process efficiently. Candles change quickly, multiple timeframes may point in different directions, and short-term movements can appear important even when they have little relevance to the wider market structure. Adding several unrelated indicators may create even more visual activity without making the underlying situation clearer.
Chart noise does not necessarily mean that the data is false. It often means that the trader is seeing many price movements without a clear method for deciding which ones deserve attention. A small reversal, for example, may be a meaningful structural change in one context but ordinary volatility in another. The same momentum reading can also have a different interpretation when the broader trend is rising, falling or moving sideways.
Trading algorithms may assist by applying consistent calculations to selected information. They can help group observations, display recurring conditions and draw attention to events that fit a chosen analytical framework. However, the output still requires interpretation. An algorithm can organize a chart; it cannot know every reason why a market is moving or determine whether a potential setup fits a trader’s circumstances.
What trading algorithms can organize
Algorithm-assisted indicators are often most useful when they bring related forms of analysis into one review process. Rather than treating every signal as an instruction to trade, a trader can use the information as a structured checklist.
| Type of information | What it may help organize | What the trader still needs to assess |
|---|---|---|
| Trend analysis | The prevailing directional conditions across a chart or multiple timeframes | Whether the trend is established, weakening or conflicting with the trading idea |
| Momentum | The strength or persistence of recent price movement | Whether momentum supports continuation or may be extended and vulnerable to change |
| Market structure | Events such as breaks of structure and changes of character | Whether the event is significant in the relevant timeframe and context |
| Market or institutional flow | Clues that may help frame directional participation and price behavior | How reliable and relevant the information is for the market being reviewed |
| Volatility references | Reference levels that reflect changing market movement | Whether the level is appropriate for the setup, timeframe and risk plan |
This kind of organization can reduce the need to switch constantly between separate tools. It may also make a trader’s review process more repeatable. Repeatability is useful because it allows the trader to compare similar situations and identify where a decision was based on a defined process rather than on a reaction to a single visual cue.
Filtering noise is not the same as predicting price
The phrase “filtering chart noise” can be misunderstood. It does not mean that an algorithm can remove uncertainty from the market or reveal only the correct future path. A filter is better understood as a way to prioritize information. It may place greater emphasis on a broader trend, a structural event or a combination of conditions, while making less prominent observations easier to ignore.
That prioritization still has limits. Markets can change direction unexpectedly, and an apparently clear structure can become less relevant after new price information appears. A signal may also be technically consistent while failing to match the trader’s intended timeframe or trading plan. For this reason, algorithm-assisted analysis should support questions such as:
- What market condition is visible beyond the latest candle?
- Do the higher and lower timeframes provide compatible information?
- Is the apparent signal part of a broader trend or a reaction inside a range?
- What evidence supports the setup, and what evidence argues against it?
- Has the market already moved too far for the original idea to remain relevant?
These questions preserve the role of human review. The goal is not to follow every alert or label automatically, but to use organized information as a starting point for a more disciplined assessment.
How trading technical analysis benefits from structured review
Trend provides the wider frame
Trend analysis gives a trader a way to describe the general direction of price. It can help distinguish between conditions that appear to support continuation and conditions where price is moving without a clear directional bias. Multi-timeframe trend assessment can add further context by showing whether a shorter-term movement is aligned with or moving against a broader trend.
A trend indication should not be treated as proof that continuation will occur. Instead, it can establish the first question in a review: what directional environment is the chart presenting? A trader may then examine whether momentum, structure and price location support the same interpretation.
Momentum adds information about movement
Momentum analysis focuses on the force or persistence behind recent price action. Strong movement may support a continuation thesis, but it can also indicate that price has moved rapidly and may be sensitive to a pause or reversal. Weak momentum can suggest limited participation, although it does not automatically mean that a reversal is coming.
Using momentum alongside trend is often more informative than viewing either measure alone. A rising trend with weakening momentum may deserve a different review from a rising trend with sustained momentum. Neither combination produces certainty, but each can help the trader frame the conditions more precisely.
Market structure helps describe turning points
Market structure tools may identify events such as a break of structure, often abbreviated as BOS, or a change of character, commonly called CHoCH. These labels can help traders describe how successive price movements relate to previous highs and lows.
The label itself is not the complete analysis. The trader still needs to consider the timeframe, the size of the move, the surrounding volatility and whether the event represents a meaningful change or a brief move through a nearby level. Structural events are most useful when they are read as part of a sequence rather than as isolated buy or sell instructions.
Smart money concepts require context
Smart money concepts are used by many traders to study market structure, liquidity-related behavior and areas where price may attract attention. A smart money indicator can organize related observations, but the terminology should not be taken to mean that the tool can directly reveal every action of institutional participants.
When reviewing smart money information, it is sensible to ask what the chart actually shows and what remains an interpretation. This helps prevent a visually persuasive label from being mistaken for verified knowledge about a specific market participant or future price movement.
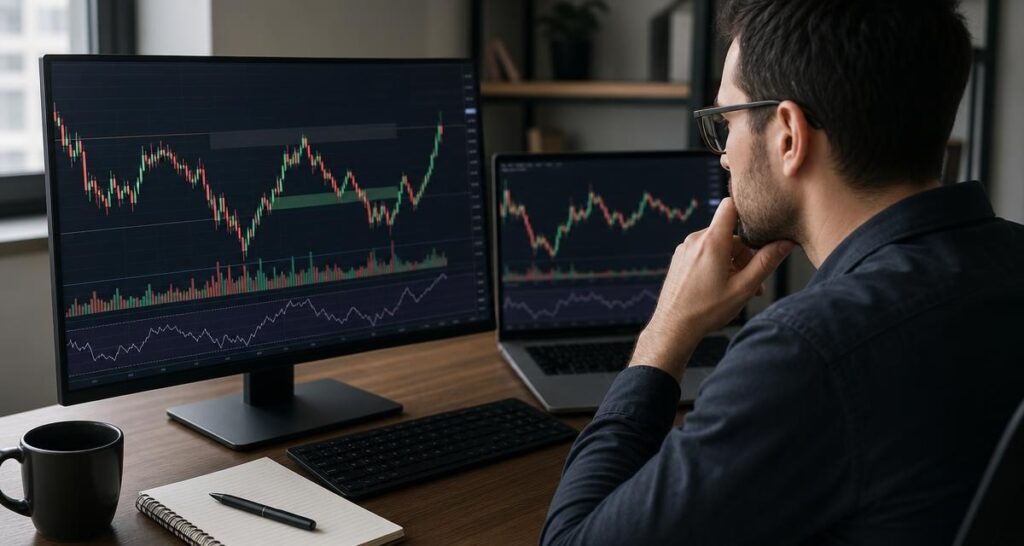
Using the AKMelytics Smart Money Indicator as an analysis aid
AKMelytics – Smart Money Indicator is a TradingView technical analysis tool offered by VP ALGO TRADING. Its stated feature set combines algorithm-assisted observations related to momentum, trend analysis, market structure, market flow, relative strength and smart money concepts. It also includes multi-timeframe analysis, BOS and CHoCH structure events, Fibonacci projections, volatility-based target and risk reference levels, a dashboard and configurable TradingView alerts.
These features can help bring several parts of a chart review into one workspace. A trader might begin with the dashboard or broader trend context, then inspect momentum and structure on the relevant timeframe. Fibonacci projections and volatility-based levels can be treated as reference points for further examination, not as guaranteed destinations or instructions.
Alerts can also support attention management. Instead of watching every candle continuously, a trader may choose to review the chart when a configured condition occurs. The alert does not remove the need to confirm what happened, whether the event is still relevant and whether it fits the trader’s own rules.
A practical workflow for human-led algorithm-assisted analysis
1. Define the question before reading the signal
Start with a specific analytical question. For example, you may want to understand whether the chart is trending, whether a recent move changed the structure or whether momentum is aligned with the broader direction. A clear question reduces the temptation to search for a convenient signal after the fact.
2. Begin with the wider timeframe
Review the broader chart context before focusing on a recent entry area. Identify whether price appears directional, range-bound or unsettled. If the tool provides multi-timeframe information, use it to compare conditions rather than assuming that every timeframe should agree.
3. Examine confluence without forcing agreement
Compare trend, momentum, structure and smart money observations. Agreement between several categories may make a setup more worthy of study, while disagreement may signal that conditions are mixed. Confluence should improve the quality of the question, not create false confidence.
4. Check the raw price action
Return to the candles and the relevant highs, lows and levels. Ask whether the algorithm-assisted interpretation is consistent with what price is doing. This step is important because an indicator can summarize information, but the chart remains the source of the underlying price behavior.
5. Consider volatility and invalidation
Reference levels based on volatility can help a trader think about how much movement the market is displaying. They should be considered alongside the trader’s own risk rules and the possibility that the premise of the setup may become invalid. No tool can remove the need to decide when an analysis is no longer valid.
6. Record the reasoning
Writing down the conditions, conflicting evidence and reason for taking or rejecting a setup can make the review more useful over time. A journal can show whether the trader is repeatedly acting on a single alert, ignoring higher-timeframe context or changing rules during stressful market conditions.
Common mistakes when using algorithm-assisted indicators
- Treating labels as commands: A buy, sell, structure or momentum label is information to review, not a substitute for a trading plan.
- Adding too many confirmations: More signals do not automatically create better analysis. Excessive overlays can recreate the same visual noise the trader was trying to reduce.
- Ignoring timeframe conflicts: A short-term bullish movement can occur within a wider bearish structure. Both observations may be valid at the same time.
- Reading historical signals as promises: A signal that appears clear after the move has happened may have felt less certain in real time.
- Confusing reference levels with outcomes: Fibonacci projections and volatility-based target or risk references are analytical aids, not guarantees about where price will travel.
- Allowing alerts to replace preparation: An alert can prompt a review, but it does not define position size, risk limits, market suitability or the final decision.
These mistakes are not specific to one indicator. They reflect a broader issue in technical analysis: tools are often easier to use than the discipline required to interpret them. A structured process helps keep the technology in its proper role.
What human review contributes
Human review contributes context that cannot be reduced to a collection of labels. Traders can consider the purpose of the analysis, the reliability of their information, the consequences of being wrong and whether the current conditions match their own experience and rules. They can also decide not to act when the evidence is contradictory.
Human judgment is not automatically better simply because it is human. It can be affected by fear, impatience, overconfidence and the desire to find confirmation. The benefit of combining human review with trading algorithms is therefore not that one eliminates the weaknesses of the other. It is that a defined tool-assisted process may make the evidence easier to inspect while the trader remains responsible for interpretation.
Questions to ask before relying on an indicator
| Review area | Useful question |
|---|---|
| Purpose | Am I using the indicator to organize information or to avoid making a judgment? |
| Context | Does the signal make sense on the timeframe and in the market structure I am studying? |
| Conflict | What evidence disagrees with the apparent setup? |
| Risk | What would show that my analysis is no longer valid? |
| Process | Can I explain the decision without relying on the label alone? |
This checklist can be applied whether a trader is using a basic TradingView indicator or a tool with several integrated features. It keeps the focus on reasoning instead of on the number of signals displayed.
Final perspective
Trading algorithms can make chart review more organized by bringing together trend, momentum, market structure, flow, relative strength and smart money observations. A tool such as the AKMelytics Smart Money Indicator may help TradingView users examine these categories through dashboards, multi-timeframe analysis, structure events, projections, reference levels and alerts.
The strongest use of algorithm-assisted analysis is not blind automation. It is a repeatable process in which the tool helps sort information and the trader assesses context, conflicting evidence and uncertainty. Used this way, an indicator can support technical analysis without pretending to remove the judgment that responsible trading requires.
Frequently asked questions
Can trading algorithms remove all noise from a chart?
No. Trading algorithms can help prioritize or organize information, but they cannot remove uncertainty or guarantee that every displayed condition is meaningful. Human review remains necessary.
Do algorithm-assisted indicators predict future prices?
They are designed to assist analysis by displaying calculated observations and reference information. They do not guarantee future price movement, profitable results or the success of a trading decision.
What does a market structure indicator show?
A market structure indicator may help identify relationships between price highs, lows and structural events such as BOS or CHoCH. The trader still needs to judge the event’s significance and timeframe.
How can momentum and trend be reviewed together?
Trend can provide the wider directional frame, while momentum can describe the strength or persistence of recent movement. Reviewing both may reveal alignment, weakening conditions or conflicting evidence.
What is the role of alerts in TradingView analysis?
Configurable alerts can notify a trader that a selected condition deserves attention. The alert should begin a chart review rather than automatically determine a trade or replace a risk assessment.
Is the AKMelytics Smart Money Indicator financial advice?
No. It is a TradingView technical analysis tool intended to support analysis and decision-making. It does not provide official financial advice, and users remain responsible for their own research and decisions.
Why is human review still important when using trading algorithms?
Human review adds timeframe, market and risk context, and it allows a trader to consider evidence that may not be captured by an indicator. It also makes it possible to reject a setup when the conditions are unclear.


Recent Comments