
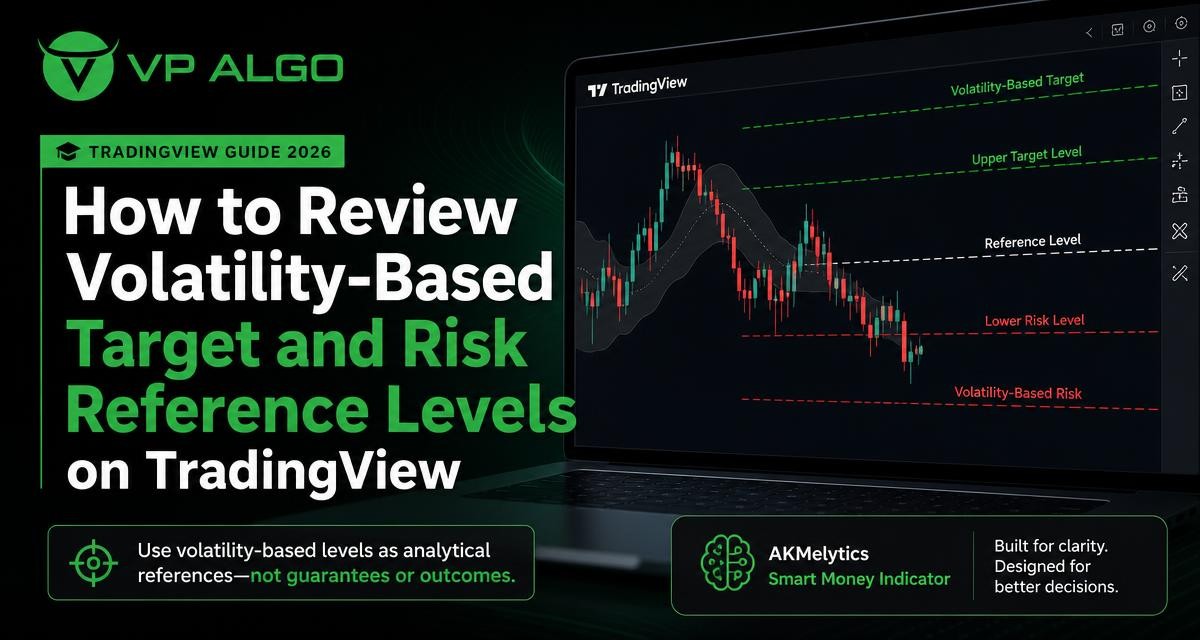
Volatility-based target and risk reference levels can help organize a chart, but they should be treated as analytical guides rather than promises about where price will move. When reviewing a TradingView trading indicator such as AKMelytics – Smart Money Indicator, the useful question is not whether a level guarantees an outcome. It is whether the level fits the current trend, momentum, market structure and broader market context.
What volatility-based reference levels are designed to show
Volatility describes how much price is moving and how widely market swings may develop over a given period. A volatility-based target level uses that context to mark a possible area where a move could encounter a reaction, slowdown or change in behaviour. A risk reference level provides another point for reviewing whether the original market idea remains valid if price moves in the opposite direction.
These levels are not the same as fixed predictions. Market conditions can change after an indicator calculates or displays a reference. A sudden expansion in volatility, a shift in momentum or a structural break can affect how relevant a level remains. For that reason, a reference level should be reviewed together with the evidence on the chart rather than used in isolation.
| Reference | What it may help you review | What it does not establish |
|---|---|---|
| Volatility-based target | A possible area for assessing price progress or a reaction | A guaranteed destination or profitable outcome |
| Risk reference level | Where the original market interpretation may need reassessment | A guarantee that losses will be limited or avoided |
| Market structure level | Whether price has maintained or broken a prior structural condition | Certainty that a new trend will continue |
| Momentum context | Whether participation and directional pressure appear supportive | Proof that price must continue in the same direction |
Begin with the market context, not the displayed level
The first step in reviewing a volatility-based level is to understand what the market is doing before focusing on the exact price. A level that appears in a strong directional move may be interpreted differently from a similar level inside a narrow or conflicting range. The same distance can also have a different meaning when volatility is expanding compared with when price movement is contracting.
Use the chart to form a basic context review. Ask whether price is making a sequence of higher highs and higher lows, lower highs and lower lows, or mixed swings. Then consider whether momentum supports the current direction and whether the larger timeframe agrees with the shorter timeframe being analysed. This process helps prevent a single indicator output from becoming the entire trading thesis.
Questions to ask before using a reference level
- Is price trending, consolidating or moving through a transition?
- Which timeframe is producing the reference, and is that timeframe relevant to the analysis?
- Has volatility recently expanded or contracted?
- Does the current market structure support the direction being considered?
- Are momentum and relative strength consistent with the price move?
- Is there conflicting information from a larger timeframe?
Review market structure around the level
Market structure gives a framework for evaluating whether a move is developing in a coherent way. Break of Structure, often abbreviated as BOS, can help traders review whether price has moved beyond a prior structural point. Change of Character, or CHoCH, is commonly used to describe a possible shift in the prior pattern. These events are analytical observations, not automatic confirmations of a future trend.
When a volatility-based target is displayed, review the structure between the current price and that reference. Has price already broken a meaningful swing point? Is the move extending from a clear structural event, or is it still trapped inside a range? A target reference may deserve more attention when the path toward it is supported by structure, while a target that conflicts with nearby swing behaviour may require more caution.
Use structure as a condition, not a prediction
Structure should help answer whether the market is behaving as expected. If price reaches a target reference but begins forming opposing swing behaviour, the reference should not be treated as an instruction to remain committed. Similarly, if price moves toward a risk reference after invalidating the original structural idea, that development may be more important than the level itself.
A TradingView trading indicator that includes BOS and CHoCH events can make these observations easier to organize visually. The events still need to be interpreted in context. A single break may be temporary, especially when the broader chart remains range-bound or momentum is weak.
Compare volatility with momentum and trend
Volatility tells you about the scale of movement, but it does not independently establish direction. A market can become more volatile while moving higher, lower or back and forth inside a range. This is why volatility-based references are more useful when reviewed alongside trend and momentum analysis.
For example, an upward reference level may receive more analytical support when the trend assessment is also upward, momentum is constructive and market structure shows a sequence of advancing swings. If momentum begins to weaken while price approaches the level, the reference may still remain visible, but the context has changed. The trader can then review whether the move is losing strength rather than assuming that the level must be reached or exceeded.
| Chart condition | How to interpret the reference | Follow-up review |
|---|---|---|
| Trend, momentum and structure agree | The level may fit the current analytical scenario | Monitor whether price continues to confirm the scenario |
| Trend agrees but momentum weakens | The move may be losing force before reaching the reference | Review new swing behaviour and momentum changes |
| Structure conflicts with the reference direction | The level may have less relevance to the current condition | Reassess the market thesis rather than forcing agreement |
| Volatility expands without clear direction | The reference may sit inside an unstable or choppy environment | Wait for clearer structure or reassess the timeframe |
Use multi-timeframe analysis to test the idea
A reference level can look convincing on one timeframe and less meaningful on another. Multi-timeframe analysis helps place the current chart in a broader sequence. The higher timeframe can provide context about the dominant structure, while the lower timeframe may show the details of momentum, breaks and retracements.
This does not mean that a higher timeframe always overrides a lower timeframe. Instead, compare the information. If the short-term chart suggests continuation while the larger chart is approaching a major structural area, the difference is part of the risk review. If several timeframes show compatible trend and structure, the reference may have stronger contextual support, though it still remains an analytical reference rather than a certain result.
A practical timeframe review
- Identify the broader direction or range on the higher timeframe.
- Mark the relevant swing points and structural events on the working timeframe.
- Review whether momentum on the lower timeframe supports or contradicts the larger context.
- Check whether the volatility-based reference sits near a meaningful structural area.
- Reassess the scenario if the timeframes provide materially conflicting information.

Distinguish a target reference from a trading decision
A displayed target can be useful for planning a review, but it is not the same as an instruction to enter, exit or hold a position. A trading decision includes additional considerations such as the market condition, the reason for the setup, the timeframe, the level of uncertainty and how the trader intends to respond if price behaves differently.
One useful approach is to write down the condition that would support the scenario and the condition that would challenge it. For example, a trader may observe that a directional move is supported by a recent structural break and compatible momentum. The trader can then identify what would make that interpretation less convincing, such as a failed break, a reversal in structure or a clear loss of momentum. This keeps the reference level within a wider decision process.
A target reference describes a possible area to review. It does not remove the need to assess confirmation, invalidation, position risk or changing market conditions.
How AKMelytics can fit into the review process
AKMelytics – Smart Money Indicator is a TradingView technical analysis tool that combines information related to momentum, trend analysis, market structure, market flow, relative strength and smart money concepts. Its features include multi-timeframe analysis, BOS and CHoCH structure events, Fibonacci projections, volatility-based target and risk reference levels, dashboard context and configurable TradingView alerts.
These features can help bring several chart observations into one review workflow. A trader might begin with the dashboard and broader trend context, examine market structure events, compare momentum and relative strength, and then inspect the volatility-based references. The indicator is intended to support analysis of potential trading setups and decision-making. It is not financial advice and does not guarantee a particular market result.
Suggested review sequence
- Open the relevant TradingView chart and identify the timeframe being analysed.
- Review the broader trend and multi-timeframe context.
- Examine recent BOS or CHoCH events and the swing points behind them.
- Compare momentum, relative strength and market flow with the direction of price.
- Study the volatility-based target and risk references in relation to structure.
- Check whether alerts or dashboard information add useful context without replacing chart review.
- Record what would support the scenario and what would require reassessment.
Common mistakes when reviewing volatility-based levels
Treating the level as a forecast
The most common mistake is assuming that a displayed level predicts the next market destination. A reference is better understood as a point for analysis. Price may react before reaching it, pass through it, or move in the opposite direction.
Ignoring changing volatility
Volatility is not static. A reference calculated in one market condition may need to be interpreted differently after a sharp expansion or contraction. Recheck the chart when the pace and size of price movement change.
Using one timeframe only
A short-term signal can conflict with a broader trend or structural area. Reviewing more than one timeframe can reveal whether the setup has wider context or is simply a local movement.
Confusing more information with more certainty
Dashboards, alerts and multiple indicator features can organize information, but they do not make uncertainty disappear. Additional signals should improve the review process, not encourage automatic decisions.
Forcing the market to match the original scenario
If price invalidates the structural or momentum conditions behind an idea, the analysis should be updated. Holding onto a target reference after its supporting context has changed can lead to a distorted reading of the chart.
Build a repeatable review routine
A consistent routine makes it easier to separate observation from assumption. Before acting on any chart idea, describe the current trend, the relevant structure, the volatility condition and the reason the reference level matters. Then state what evidence would weaken that interpretation. This simple process can reduce the temptation to focus only on a preferred outcome.
Keep records of the chart context and the reasoning used at the time. The purpose is not to claim that a particular result was predictable. Instead, a journal can show whether the review process consistently considered structure, momentum, timeframe and changing volatility. Over time, that information may help traders identify where their analysis is clear and where it relies on unsupported assumptions.
Final perspective
Volatility-based target and risk reference levels are most useful as part of structured trading technical analysis. They can help traders frame possible areas of interest and review where a market scenario may need attention. Their value depends on context: trend, momentum, market structure, timeframe and the way price responds after the level appears.
A TradingView trading indicator such as AKMelytics can organize these observations through market structure events, multi-timeframe context, momentum-related information and volatility-based references. The final interpretation remains the trader’s responsibility. No indicator can guarantee profits, eliminate losses or replace careful assessment of uncertainty and risk.
Frequently asked questions
What is a volatility-based target reference level?
It is an analytical price area derived from volatility-related information and used to review where a move might encounter a reaction or change. It is not a guaranteed destination.
What is a risk reference level?
A risk reference level is an area that can help a trader assess whether the original market interpretation is still valid if price moves against the scenario. It does not guarantee that losses will be limited or avoided.
Should I use a target level without checking market structure?
No. Market structure helps show whether the price move has meaningful support from swing behaviour and structural events. A target should be reviewed alongside structure rather than treated as a standalone signal.
Why does multi-timeframe analysis matter?
Different timeframes can show different parts of the same market movement. Comparing them helps reveal whether a short-term scenario agrees with or conflicts with the broader trend and structural context.
Can a TradingView trading indicator guarantee a trading outcome?
No. An indicator can organize and display analytical information, but it cannot guarantee profits, remove uncertainty or predict every market movement.
How can AKMelytics support chart analysis?
AKMelytics combines features related to trend, momentum, market structure, market flow, relative strength, smart money concepts, multi-timeframe analysis, alerts and volatility-based references. It is designed to support analysis and decision-making, not provide financial advice.


Recent Comments