
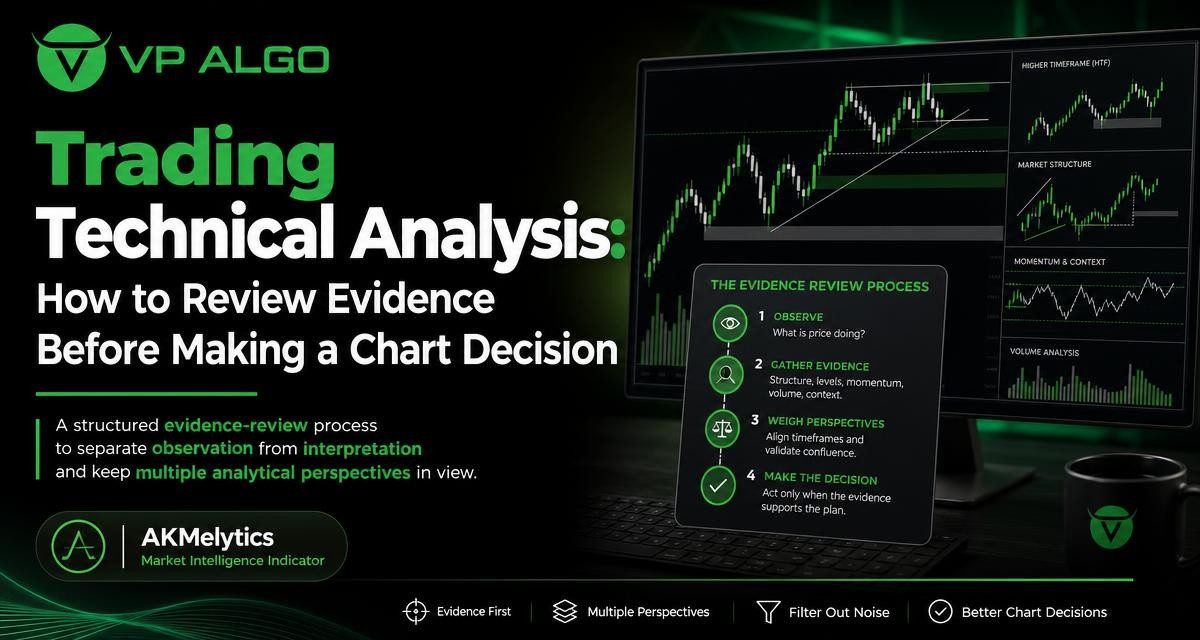
Trading technical analysis is most useful when it helps you review evidence in stages rather than rushing from a visual pattern to a trade decision. A chart can show direction, momentum, structure and changing participation, but each observation still needs context. Separating observation from interpretation gives traders a clearer way to assess what the market is doing, what may be developing and what remains uncertain.
Why a staged review improves chart decisions
Charts contain several layers of information at once. Price may be rising while momentum is weakening. A market may remain inside a broader range even though a lower timeframe shows a strong move. A structure break may look significant on one timeframe but have little relevance on a higher one. Reviewing these elements in a fixed order helps prevent one attractive signal from dominating the entire analysis.
The purpose is not to create certainty. Technical analysis cannot eliminate market risk or guarantee a result. Instead, it provides a repeatable framework for describing conditions, testing an interpretation and deciding whether the available evidence is sufficient for further planning.
Observation is not the same as interpretation
An observation describes something visible or measurable on the chart. For example, price has formed a sequence of higher highs and higher lows on a selected timeframe. An interpretation adds meaning to that observation, such as the view that buyers may be controlling the current move. The interpretation may be reasonable, but it remains a conclusion that should be tested against other evidence.
Keeping these two steps separate reduces confirmation bias. A trader can write down what is visible first, then ask whether momentum, structure and broader context support the initial reading.
Stage one: Establish the chart context
Begin with the basic conditions surrounding the chart. Record the instrument, timeframe and visible price range being reviewed. Then identify whether the market appears to be trending, ranging, consolidating or moving through a transition. This first classification does not need to be perfect. It simply gives the rest of the review a working context.
Timeframe matters because the same price movement can have different meanings at different scales. A short-term rise may be a continuation move within a larger decline, while a narrow consolidation may be a pause inside a wider trend. Comparing more than one timeframe can help distinguish local movement from broader structure, but the timeframes should be chosen consistently rather than changed to support a preferred conclusion.
A simple context checklist
- Which instrument and timeframe are being reviewed?
- Is price trending, ranging, consolidating or transitioning?
- Where are the most recent significant highs and lows?
- Is the current price near a recent boundary, range edge or structural level?
- Does the selected timeframe agree with the broader chart context?
Stage two: Describe trend direction without overcommitting
Trend analysis is often the first layer traders examine, but it should be treated as a description of recent price behavior rather than a prediction. A series of higher highs and higher lows can describe an upward structure. Lower highs and lower lows can describe a downward structure. Alternating swings with no clear progression may indicate a range or unsettled condition.
Moving averages or a trend indicator for TradingView can help organize this review, particularly when a trader wants a consistent visual reference. However, an indicator is an aid to interpretation, not a replacement for examining price. A line that shows direction may react after the market has already moved, and a trend reading can become less useful during sideways conditions.
Questions to ask about trend
- Is the trend visible on the chosen timeframe or only on a smaller chart?
- Are recent swings extending the established direction or failing to do so?
- Has price returned to a prior level, creating a potential test of the trend?
- Is the market moving steadily, or is the direction being driven by a brief extension?
These questions help distinguish a sustained directional condition from a temporary price burst. They also make it easier to record uncertainty instead of forcing a bullish or bearish label when the evidence is mixed.
Stage three: Review momentum as confirmation, not a command
Momentum analysis examines the strength and persistence of a move. Price can continue in one direction while momentum slows, and that difference may be worth monitoring. It does not automatically mean that a reversal will follow. Likewise, strong momentum can support continuation, but it does not establish how far the move may travel.
A momentum indicator can provide a standardized way to compare current movement with recent behavior. The useful question is not simply whether momentum is high or low. Ask whether momentum agrees with the price structure, is diverging from it or is changing after a period of consolidation.
| Observation | Possible interpretation to test | Follow-up question |
|---|---|---|
| Price and momentum move in the same direction | The current move may have internal support | Is the move also consistent with the higher-timeframe structure? |
| Price advances while momentum weakens | The move may be losing force or entering a more selective phase | Has price reached a significant structural area? |
| Price consolidates while momentum changes | Participation may be shifting before a clearer move | Has price confirmed a breakout or breakdown? |
| Momentum is volatile in both directions | The market may lack a stable directional condition | Would a range-based interpretation be more appropriate? |
The table illustrates why momentum should be treated as one part of the review. The same momentum reading can have different significance depending on location, trend and structure.
Stage four: Map market structure
Market structure focuses on the relationship between important highs, lows, breaks and retests. It helps answer a practical question: has the market actually changed its sequence, or is the latest movement still contained within the previous structure?
A market structure indicator can make swing relationships easier to monitor, especially when a chart contains many candles or several possible turning points. Even so, traders should understand what the indicator is labeling. Different tools may define a swing, break or confirmation differently. The label should therefore be reviewed against the underlying price action rather than accepted without inspection.
Structure questions for a careful review
- Which highs and lows are significant for the selected timeframe?
- Has price broken a prior swing, or only moved temporarily beyond it?
- Was the break followed by acceptance, rejection or a return into the prior range?
- Does the apparent structure change agree with the higher-timeframe picture?
- Is the chart showing continuation, a failed break or a transition?
Structure is especially useful for preventing premature conclusions. A single candle beyond a level may be an observation, but deciding that it represents a lasting change requires additional evidence, such as follow-through or a meaningful retest.
Stage five: Consider participation and smart money concepts carefully
Some traders use smart money concepts and institutional activity analysis to add another perspective to price and structure. These approaches may focus on areas where significant buying or selling could have influenced movement, along with displacement, liquidity behavior or reactions around important levels. They can be useful as interpretive frameworks, but they should not be presented as direct knowledge of every participant’s intentions.
Terms such as “institutional flow” can sound more precise than the available evidence allows. A chart-based reading is still an inference. Treat it as a hypothesis to compare with trend, momentum and structure. If the perspectives disagree, that disagreement is itself useful information: it may suggest that the market is less clearly defined than one isolated signal implies.

How to combine several analytical perspectives
A multi-perspective review works best when each layer answers a different question. Trend describes direction, momentum describes force, structure describes organization and participation-based concepts offer an additional interpretation of where interest may be concentrated. The goal is not to make every layer produce the same signal. The goal is to understand why they agree or disagree.
| Analytical layer | Main question | What disagreement may indicate |
|---|---|---|
| Trend | What direction has price recently established? | The market may be ranging or transitioning |
| Momentum | How strongly is the current move developing? | The move may be weakening or unstable |
| Market structure | Have important highs or lows changed relationship? | The apparent move may not have structural confirmation |
| Participation and smart money concepts | Where might important reactions or concentration appear? | The interpretation may need more price confirmation |
| Multiple timeframes | Does the local view fit the broader context? | The setup may be timeframe-specific |
For example, a lower-timeframe upward move may occur inside a higher-timeframe range. Trend may look positive locally, momentum may be strong, but structure may show that price is approaching a broader boundary. That does not determine the outcome. It simply means the chart deserves a more cautious interpretation than a single bullish signal might suggest.
Using a trading indicator as a review aid
A trading indicator can reduce the effort required to organize several observations on a TradingView chart. The value comes from helping the trader see relevant information consistently, not from turning a complex market into a simple instruction. An indicator should support a defined review process and remain subject to the trader’s own checking.
VP ALGO TRADING develops and sells TradingView indicators and algorithmic trading tools. Its approved market intelligence offering, AKMelytics – Market Intelligence Indicator, fits the broader use case of examining market information through a structured lens. As with any charting tool, users should understand the conditions represented by its displays and avoid treating them as financial advice or guaranteed trade outcomes.
Questions to ask before relying on an indicator display
- What calculation, condition or price relationship does the display represent?
- Does the signal appear on the current timeframe, higher timeframes or both?
- Can the display change as new candles form?
- What market conditions may make the reading less informative?
- What independent price evidence would confirm or challenge the interpretation?
Build a written evidence record
Writing down the review can expose gaps that are easy to miss when scanning a chart. A short record might include the chart context, direct observations, interpretations, conflicting evidence and conditions that would invalidate the current view. This process makes the analysis easier to revisit without relying on memory.
Example evidence record
- Context: Record the instrument, timeframe and broader market condition.
- Observation: Describe recent highs, lows, direction and momentum without predicting.
- Interpretation: Explain what those observations may suggest.
- Challenge: List evidence that does not support the interpretation.
- Condition: Define what future price behavior would strengthen, weaken or invalidate the view.
This is not a requirement to predict every possible outcome. It is a way to keep the reasoning visible. A clear invalidation condition can be more useful than a confident but vague forecast because it identifies when the original interpretation no longer fits the chart.
Common mistakes in trading technical analysis
Starting with a trade idea
When a trader begins with a preferred long or short view, evidence may be selected to defend that view. Starting with neutral observations makes it easier to notice contradictory information.
Using too many indicators
Adding more displays does not necessarily add more information. Several indicators may measure similar aspects of price and create the appearance of agreement. Choose tools that answer different questions, such as direction, momentum and structure.
Confusing a signal with a complete setup
A signal can identify a condition worth investigating, but it does not automatically define context, risk, timing or suitability. A complete review still requires the trader to assess the wider chart and their own plan.
Ignoring the timeframe
A setup that appears clear on a small timeframe may conflict with a larger structure. Always record the timeframe and check whether the local interpretation fits the broader view.
A practical workflow for the next chart review
Use the following sequence when you want a repeatable process:
- Start with the higher-level chart context.
- Describe the current trend or range without making a forecast.
- Mark relevant highs, lows and structural boundaries.
- Review momentum and compare it with price behavior.
- Consider participation or smart money concepts as hypotheses, not facts.
- Check whether multiple timeframes support the same interpretation.
- Record conflicting evidence and define what would change your view.
- Only then decide whether the chart warrants further planning or no action.
This workflow keeps the emphasis on evidence. It also creates room to conclude that the market is unclear, which is a valid analytical result. Not every chart provides a sufficiently consistent picture for a decision.
Frequently asked questions
What is trading technical analysis?
Trading technical analysis is the study of price behavior and related chart information to assess market conditions. It can include trend, momentum, market structure, volume-related observations and multiple-timeframe review.
Why separate observation from interpretation?
Separating them helps reduce confirmation bias. You first record what the chart shows, then test the meaning you assign to those observations against other evidence.
What does a market structure indicator do?
A market structure indicator can help display relationships between swings, breaks and other structural conditions. Its labels should still be checked against the underlying price action and the timeframe being used.
Can momentum confirm a trading decision?
Momentum can add context about the strength or persistence of a move, but it cannot guarantee continuation or reversal. It is best reviewed alongside trend, structure and price location.
How do smart money concepts fit into chart analysis?
Smart money concepts provide an interpretive framework for examining potential areas of concentrated interest and important reactions. They should be treated as hypotheses rather than proof of specific participant intentions.
Can a TradingView indicator replace personal analysis?
No. A TradingView indicator can organize information and support a review process, but users should understand its displays, consider its limitations and make their own informed assessment.
Does technical analysis guarantee profitable results?
No. Technical analysis is not a guarantee of profits and does not remove trading losses or market uncertainty. It is a framework for evaluating evidence, not a promise about future performance.


Recent Comments