
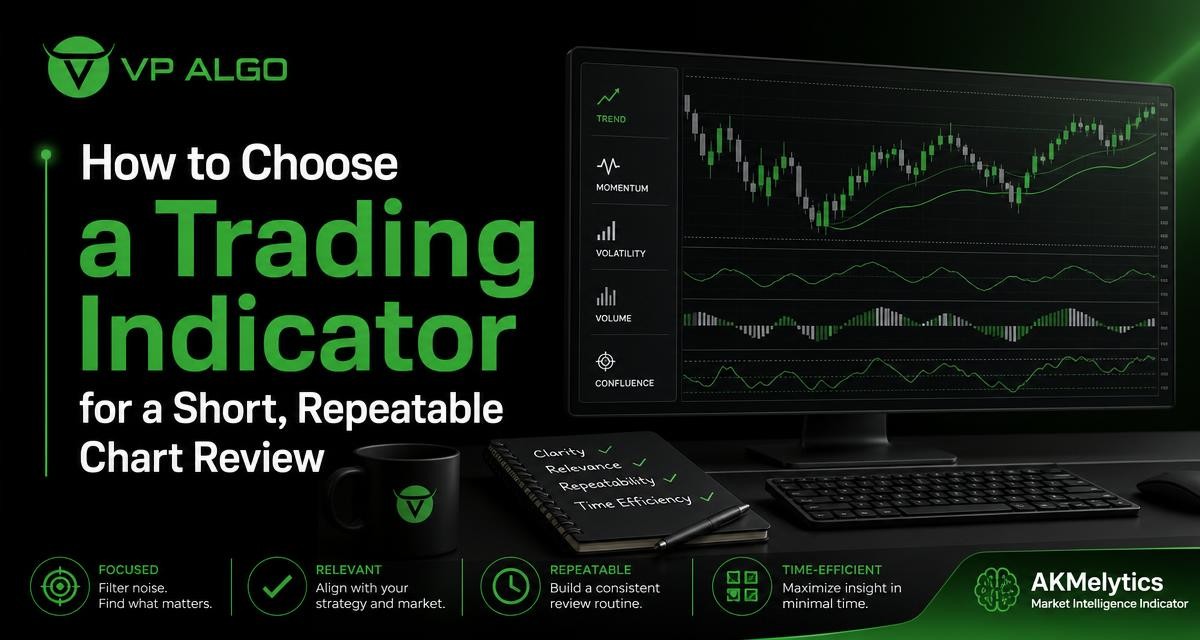
Choosing a trading indicator is not simply a matter of finding the tool with the longest feature list. A useful indicator should help you review a chart consistently, highlight information that matters to your method and remain clear when your available attention is limited. This guide explains how to assess a trading indicator for a short, repeatable chart review, including what to examine before adding it to your TradingView workflow.
Start with the job the indicator must do
Before comparing tools, define the decision you want the indicator to support. A trader may need help identifying the broader trend, reviewing momentum, interpreting market structure or examining signs of institutional activity. These are different jobs, and a tool that is useful for one may add little value for another.
Writing down the purpose also helps separate a genuine need from curiosity. If your review routine already shows trend direction clearly, adding another trend display may make the chart busier without improving your process. On the other hand, if you regularly struggle to organise trend, momentum and structure into one consistent review, a multi-feature trading indicator may deserve closer examination.
- Trend: Does the tool help you assess the general direction or condition of the market?
- Momentum: Does it provide information about strength, weakness or changing market pressure?
- Market structure: Does it help you review swings, breaks or other structural information?
- Institutional or smart money context: Does it add a clearly explained perspective on activity and market behaviour?
- Timeframe context: Can you use it consistently when reviewing more than one timeframe?
The objective is not to select every available function. It is to identify the small set of information that supports your own chart-review questions.
Match the trading indicator to your attention window
A short chart review needs a different type of tool from an open-ended research process. When you have only a few minutes, the indicator should make important information easier to locate. Labels, colours and panels should support a quick reading rather than require extensive interpretation every time you open a chart.
Clarity does not mean that an indicator must be simple in every technical respect. A tool can include several analytical components while still being practical if each component has a distinct purpose. The important question is whether you can explain what you are seeing and apply the same review sequence from one chart to the next.
| Review need | What to look for | Potential issue |
|---|---|---|
| Trend assessment | A clearly presented trend condition or directional framework | Conflicting signals from several unrelated trend displays |
| Momentum review | Readable information about strength or weakening pressure | Too many alerts or values that are difficult to interpret |
| Market structure | Consistent visual references for structural changes | Labels that obscure candles or create unnecessary noise |
| Multi-timeframe review | A practical way to compare broader and nearer-term context | Using higher-timeframe information without understanding its timing |
| Routine consistency | A repeatable order for reviewing the tool | Changing settings or interpretation from chart to chart |
Prioritise relevant features over a long feature list
Trend analysis
Trend analysis can provide an initial frame for a chart review. It may help you ask whether the market is showing directional movement, a weaker condition or a less decisive environment. That context can be useful before you examine a possible setup, because the same price pattern may have a different meaning depending on the broader market condition.
When assessing a trend feature, look for a presentation that you can interpret consistently. Ask whether it is clear on the timeframes you review and whether it complements, rather than duplicates, information already on your chart. A trend indicator is most useful when it gives your process a defined question to answer instead of encouraging automatic decisions.
Momentum evaluation
Momentum information can help you examine whether movement appears to be strengthening, weakening or losing direction. It should not be treated as a guarantee that price will continue in one direction. Instead, it can be one part of a broader review that includes price action, structure and the conditions of the market being analysed.
For a short routine, a momentum feature should be easy to check without demanding a separate research process. Consider whether its visual signals are understandable, whether they repeat too frequently and whether you know how they fit into your trading strategy. If you cannot explain what a momentum reading changes in your review, it may not deserve priority.
Market structure
Market structure focuses attention on how price is organising itself through swings and changes in direction. A market structure indicator may help traders review this information more systematically, particularly when manual chart marking becomes inconsistent or takes too long.
However, structure labels still require interpretation. A visible mark on a chart is not a complete trading decision. Review how the tool defines or presents structural changes, and decide in advance how that information fits with your other checks. The best result is a clearer process, not a chart covered with signals that you follow without context.
Institutional activity and smart money concepts
Some tools include features related to institutional activity, smart money concepts or flow monitoring. These features may offer another way to examine market behaviour, but they should be understood on their own terms. Read the available product information and determine what the display is designed to represent before including it in a routine.
A smart money indicator can be useful as a structured source of context when it is combined with a defined review method. It should not be presented as proof that a particular market participant will act next, nor should it replace risk management, independent analysis or careful decision-making.
Check whether the indicator supports a repeatable sequence
A repeatable review is easier to maintain when it follows the same order each time. The sequence can be short, but it should be specific enough to reduce inconsistent interpretation. For example, a trader might begin with the broader timeframe, check trend and structure, review momentum, then consider whether the nearer-term chart agrees with the broader context.
The exact order depends on the trader and the chosen method. What matters is that the indicator helps you ask the same questions rather than encouraging a new interpretation on every chart. A useful routine could include the following steps:
- Define the chart and timeframe: Be clear about what market view you are reviewing.
- Check the broader condition: Note whether the trend or structure provides a clear context.
- Review momentum: Look for supporting, weakening or mixed information.
- Examine the nearer-term picture: Consider whether it agrees with or conflicts with the broader view.
- Record uncertainty: If the tool produces conflicting information, treat that as part of the review rather than forcing a conclusion.
A routine like this does not make a trading decision automatically. It creates a consistent way to gather and organise information. That distinction matters because indicators are analytical tools, not substitutes for judgement.
Consider multi-timeframe information carefully
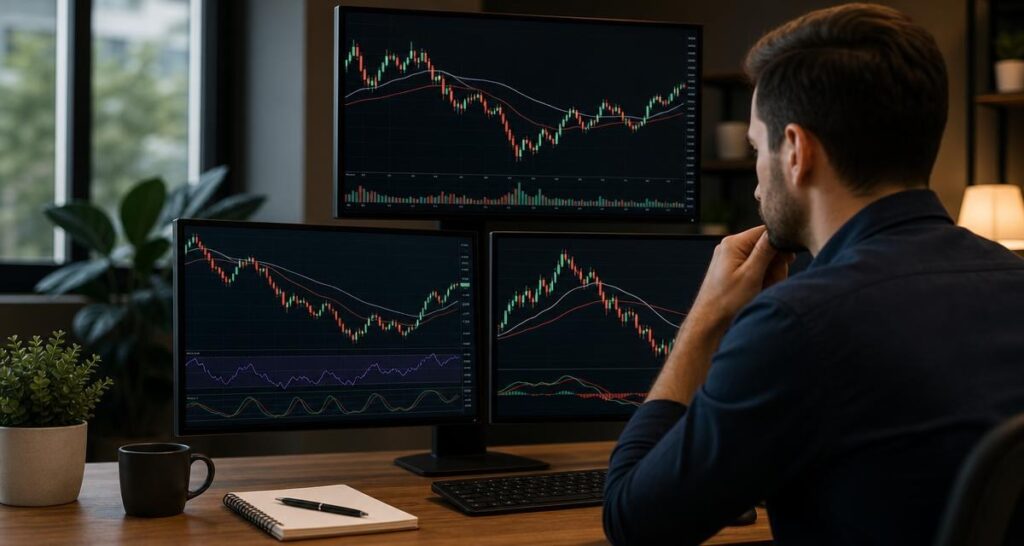
Multi-timeframe trend assessment can be helpful when a trader wants to compare a broader market condition with a more detailed chart. It may reduce the risk of viewing a short-term move in isolation. At the same time, different timeframes can produce information that appears to disagree, especially when price is moving through a transition.
When evaluating this feature, ask how the indicator presents timeframe information and whether you understand when that information can change. Avoid treating a higher-timeframe reading as a permanent conclusion. A concise review should acknowledge that market conditions develop and that the meaning of a reading depends on the timeframe and the rest of the chart.
Evaluate visual clarity before adding more tools
A chart can become less useful when each new indicator adds another colour, label or panel. The problem is not limited to beginners. Experienced traders can also lose the main structure of a chart when too many tools compete for attention.
Before choosing a trading indicator, inspect how it affects the chart at the scale you actually use. Look for readable markings, logical grouping and a presentation that does not hide the candles or important price areas. If the tool has several components, determine which ones are essential to your routine and which ones can be left aside.
- Can you identify the main reading within a few seconds?
- Do the colours and labels have consistent meanings?
- Does the display remain readable when the chart contains normal price movement?
- Can you remove non-essential elements without losing the core function?
- Does the indicator reduce repeated manual work, or does it create more questions?
These questions are particularly relevant for a short review. A tool that looks impressive during a long demonstration may not be practical when you need a clear answer quickly.
Test the tool against your existing trading strategies
An indicator should fit the logic of your trading strategies rather than dictate a method you do not understand. Start by describing your current approach in plain language. Does it rely mainly on trend, structure, momentum, price behaviour or a combination of these? Then identify where the indicator could support that approach and where it might introduce duplication.
Use a consistent observation period when testing the workflow. Review different charts and market conditions without changing the rules every time the result is unclear. The purpose is not to search for a perfect setting or to assume that a favourable historical example will repeat. It is to learn whether the tool makes your analysis more organised, understandable and consistent.
A good test asks whether the indicator improves the quality of your review, not whether it can produce a certain outcome on demand.
Keep notes on questions such as:
- What did the indicator show?
- What did you expect it to show?
- Did it agree with your existing analysis or add a different perspective?
- Did you understand the reason for any change in the display?
- Did the tool make the review faster without making it less careful?
Understand what a TradingView indicator can and cannot do
A TradingView indicator can organise technical information directly on a chart, but it does not remove the need for interpretation. It cannot guarantee a market outcome, eliminate losses or replace a complete trading plan. Its role is to help a trader examine selected conditions in a more structured way.
VP ALGO TRADING develops and sells indicators and algorithmic trading tools for TradingView. Its identified offerings include the AKMelytics – Market Intelligence Indicator, while the company describes its indicator capabilities in relation to trend analysis, momentum, market structure, institutional activity, multi-timeframe assessment and smart money analysis. Readers should review the product information and support available from the company to understand the current tool, access process and intended use.
The company also positions its indicators for educational and trading-decision assistance purposes rather than as financial advice. That distinction should remain part of your evaluation. A product may help organise a chart review, but each trader remains responsible for understanding the tool and applying appropriate judgement.
Review access, installation and support expectations
Practical details matter when selecting a commercial trading indicator. Before committing to a workflow, confirm how access is provided, what information is needed for activation and where to ask for installation or usage help. VP ALGO TRADING states that customers provide their TradingView ID by email after purchase and can contact support for installation, activation or usage assistance.
The website also offers a request-based 7-day free trial for its indicator and Telegram channel. Because eligibility and other terms can change, confirm the current details directly with the company before relying on a trial as part of your evaluation. The key question is whether you can access and understand the tool well enough to judge its fit with your review routine.
A simple selection checklist
Use the following checklist before choosing a trading indicator for a concise chart review:
- Purpose: Can you state the specific analysis problem the tool should help with?
- Relevance: Do its features match your preferred trading strategies and review questions?
- Clarity: Can you interpret the display without repeatedly consulting instructions?
- Timeframe fit: Does it work within the timeframes you actually review?
- Visual discipline: Can you keep the chart readable and remove unnecessary elements?
- Consistency: Can you apply the same review sequence across different charts?
- Limits: Do you understand that the indicator provides analysis rather than guaranteed outcomes or financial advice?
- Practical access: Are installation, activation and support expectations clear?
If a tool meets these requirements, it may be worth including in a structured evaluation. If it fails several of them, adding more features is unlikely to solve the underlying problem. A focused trading indicator that you understand can be more useful than a crowded chart full of disconnected readings.
Frequently asked questions
What is the most important feature in a trading indicator?
The most important feature is the one that addresses a real need in your review process. Depending on your method, that may involve trend, momentum, market structure, multi-timeframe context or smart money analysis. Relevance and clarity matter more than the number of features.
How many indicators should I use on a chart?
There is no universal number. Use only the tools you can interpret consistently and that contribute distinct information. If several indicators repeat the same reading or make the chart difficult to read, simplify the display.
Can a trading indicator choose trades for me?
No. An indicator can organise or display analytical information, but it does not guarantee a result or replace your trading plan and judgement. It should be treated as decision-support information rather than automatic financial guidance.
Is a smart money indicator suitable for a short chart review?
It can be suitable if its presentation is clear and its information fits your review questions. Before using one, understand what its features represent and how they relate to trend, momentum and market structure. Do not treat a smart money reading as proof of a future market move.
Why is multi-timeframe analysis useful when reviewing a chart?
It can help you compare broader conditions with nearer-term price behaviour. This may provide context, but different timeframes can also disagree. Review the information carefully and avoid treating any timeframe reading as a guarantee.
What should I check before buying a TradingView indicator?
Check the tool’s purpose, features, visual clarity, timeframe fit, access process and support arrangements. Also confirm how the indicator fits your existing trading strategies and remember that it is intended for analytical assistance, not guaranteed performance or financial advice.


Recent Comments