
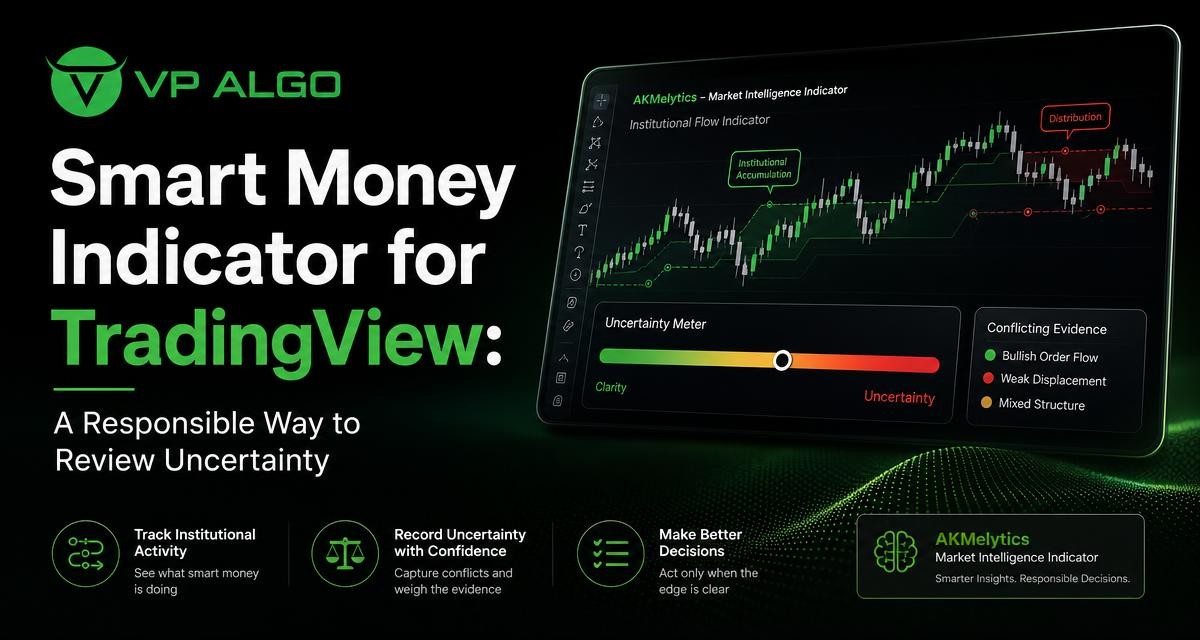
A smart money indicator for TradingView can help organize observations about trend, momentum, market structure, institutional activity, and smart money concepts. It cannot remove uncertainty from a market decision. A more responsible approach is to treat each feature as evidence, record what supports an idea, and identify what conflicts with it before taking any further action.
What a smart money indicator is designed to show
The phrase “smart money” generally refers to the attempt to study how larger or more informed market participants may be influencing price. On a chart, this can involve looking at market structure, changes in momentum, trend direction, and signs associated with institutional activity. These observations are interpreted from market data; they are not direct confirmation of who placed a trade or why.
A TradingView indicator that combines several of these areas can give a trader a more structured chart-reading process. Instead of switching between unrelated tools, the trader can review multiple dimensions of market behaviour in one workflow. The result should be a clearer record of the evidence, not an assumption that a signal is certain.
Why the word “indicator” matters
An indicator processes or displays information according to its design. It does not know a trader’s objectives, risk limits, time horizon, or broader financial circumstances. It also cannot guarantee how price will behave after a condition appears. Even a well-organized chart may contain incomplete, delayed, or conflicting information.
This distinction is especially important when using an institutional flow indicator or smart money trading indicator. A displayed condition can support a market hypothesis, but it should be reviewed alongside price behaviour and the broader context on the chart.
Why conflicting evidence is normal
Markets do not move because every measured condition agrees at the same time. A chart may show a rising trend while short-term momentum weakens. Market structure may remain constructive while a lower timeframe begins to break down. An institutional activity feature may suggest increased attention while price remains range-bound.
These conflicts are not necessarily a defect in the tool. They may indicate that the market is transitioning, consolidating, reacting to new information, or being viewed across timeframes with different objectives. Recording the disagreement can be more useful than forcing the chart into a simple bullish or bearish label.
Common sources of uncertainty
- Different timeframes: A longer timeframe may show an established trend while a shorter timeframe shows a countertrend move.
- Lagging confirmation: A trend or momentum condition may appear after price has already moved.
- Range-bound conditions: Repeated signals may occur without a sustained directional move.
- Interpretation risk: A visual marker can be mistaken for a prediction rather than one piece of evidence.
- Incomplete context: An indicator does not automatically account for every event, market condition, or external factor affecting price.
A practical framework for reviewing a smart money chart
A responsible review begins before a signal becomes emotionally important. Define the question you are asking, identify the timeframe, and list the evidence without immediately assigning certainty to it. For example, the question might be whether the current structure supports continuation, whether momentum is improving, or whether a possible institutional activity condition deserves further observation.
The following sequence can help keep the review consistent.
1. Establish the broader trend
Begin with the trend direction on the timeframe that matches the purpose of your analysis. Look for the sequence of price movements and the way the indicator presents trend conditions. Avoid describing a market as strongly directional merely because one recent candle or marker points in one direction.
A trend indicator for TradingView is most useful when it provides context for the current price rather than becoming the entire decision process. Record whether the trend is rising, falling, or unclear, and note the timeframe used.
2. Review market structure
Market structure focuses on how price forms highs, lows, breaks, and consolidations. A market structure indicator may help draw attention to these developments, but the trader still needs to examine the underlying chart. Ask whether a structure change is sustained, whether it occurs within a wider range, and whether the move agrees with the higher timeframe.
Structure should be described precisely. “Price moved above a recent high” is more useful than “the market is definitely bullish.” The first statement records an observation; the second adds a level of certainty that the chart may not justify.
3. Assess momentum separately
Momentum describes the strength or pace of a move. A momentum indicator for TradingView may show that directional pressure is increasing, decreasing, or failing to confirm the current trend. Momentum and trend can disagree without either feature being invalid. For example, an established uptrend may lose momentum while still remaining structurally intact.
Write down the relationship between the two observations. “Trend remains positive, but momentum has weakened” is a useful uncertainty statement. It keeps both facts visible and avoids treating a single feature as decisive.
4. Treat institutional activity as a clue, not proof
An institutional flow indicator may be used to organize observations associated with institutional activity or smart money concepts. Such a feature should not be interpreted as direct access to the intentions, identities, or future actions of market participants. It is better viewed as contextual information that may support or challenge an existing market hypothesis.
When the activity feature conflicts with price structure, record both sides. For example, an observation might state that the activity reading is notable, while price has not yet confirmed a meaningful structural change. That wording preserves the distinction between attention and confirmation.
5. Check alignment across timeframes
Multi-timeframe trend assessment can reduce the risk of treating a short-term movement as the complete market picture. Review the timeframe used for the broader context, then compare it with the timeframe used for the more immediate observation. The goal is not to make every timeframe agree. The goal is to understand where they disagree and why that matters to the analysis.
| Area reviewed | Question to ask | How to record uncertainty |
|---|---|---|
| Trend | Is direction clear on the selected timeframe? | State whether the trend is rising, falling, mixed, or unclear. |
| Market structure | Has price confirmed a meaningful change? | Describe the observed high, low, break, or range without predicting the next move. |
| Momentum | Is momentum supporting or weakening the trend? | Record agreement, divergence, or insufficient confirmation. |
| Institutional activity | Does the activity feature add context? | Label it as supporting evidence, conflicting evidence, or an observation requiring more review. |
| Timeframe alignment | Do the selected timeframes tell the same story? | List the differences instead of averaging them into one conclusion. |
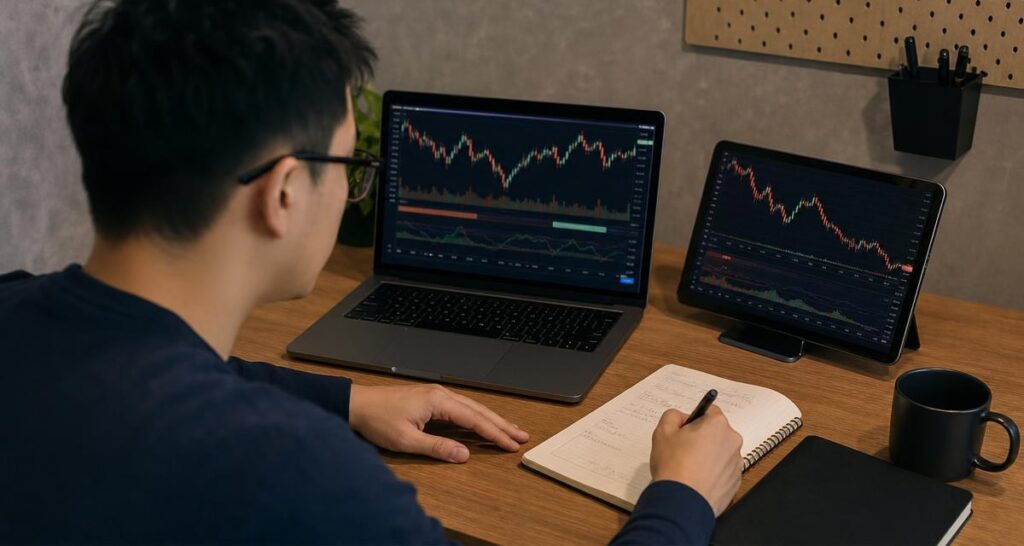
How to create an uncertainty record
A short written record can make chart analysis more disciplined. It does not need to be complicated. The important point is to separate observations from interpretations and to document what would challenge the current view.
Use three categories of notes
- Observed evidence: Write what the chart and indicator are displaying. Include the timeframe and the relevant feature, such as trend, momentum, structure, or activity.
- Interpretation: Explain what the evidence might mean, using cautious language such as “may support,” “could indicate,” or “does not yet confirm.”
- Disconfirming evidence: Record the information that would weaken the interpretation, including a structure failure, continued range movement, or disagreement from another timeframe.
This format discourages hindsight. If only supporting evidence is written down, the record can make a decision appear more obvious than it was at the time. Including conflicting evidence provides a more honest view of the analysis.
Example of a balanced note
“The higher timeframe trend is upward, and the current structure has not clearly broken. Shorter-term momentum is weaker, while the institutional activity feature provides additional context but not direct confirmation. The market remains subject to uncertainty because price is near a recent range boundary.”
This example does not produce a buy or sell instruction. It records the state of the evidence and identifies why the interpretation remains conditional.
Using an indicator without outsourcing judgment
A smart money indicator for TradingView can make a repeatable review easier, particularly when it brings trend analysis, momentum evaluation, market structure, institutional activity, and smart money features into one charting process. The tool can help a trader notice relationships that might otherwise be missed.
However, repeatability is not the same as certainty. A consistent process can still produce an uncertain conclusion. The trader remains responsible for deciding whether the information is relevant to the analysis, whether the timeframe is appropriate, and whether the possible downside is acceptable within their own approach.
Avoid common interpretation errors
- Do not count every feature as independent confirmation. Several displayed conditions may be related to the same underlying price movement.
- Do not treat a marker as a forecast. A signal describes a condition according to the indicator’s design; it does not promise what happens next.
- Do not ignore failed signals. Recording cases where an interpretation did not develop as expected helps maintain realistic expectations.
- Do not change the timeframe after seeing the result. Keep the review consistent so that the analysis is not shaped by hindsight.
- Do not use technical evidence without a risk framework. An indicator cannot determine how much exposure is appropriate for an individual.
Where AKMelytics fits into the review process
AKMelytics – Market Intelligence Indicator is positioned as a TradingView tool for reviewing market intelligence through features related to trend analysis, momentum, market structure, institutional flow monitoring, multi-timeframe trend assessment, and smart money analysis. These capabilities can support a structured chart review when the trader uses them to compare evidence rather than search for certainty.
A practical workflow is to begin with the chart’s broader context, review the available conditions, and then write down both agreement and conflict. If the product or its features require installation, activation, or usage assistance, VP ALGO TRADING provides support for those product-related questions. The indicator is intended for educational and trading-decision assistance purposes, not as financial advice.
A simple checklist before relying on a reading
- Have you identified the timeframe and the question being examined?
- What does the broader trend show?
- What is the current market structure?
- Is momentum confirming, weakening, or unclear?
- What does the institutional activity or smart money feature add?
- Which observations conflict with the main interpretation?
- What evidence would invalidate or weaken the current view?
- Have you kept observations separate from assumptions about future price?
If several answers are unclear, that is meaningful information. Uncertainty does not have to be disguised as a signal. It can be recorded as the current conclusion and reviewed again when new chart information becomes available.
Final perspective
The responsible use of a smart money indicator for TradingView is less about finding a perfect signal and more about improving the quality of the review. Trend, momentum, market structure, institutional activity, and multi-timeframe analysis can each contribute useful context, but none should be treated as a guarantee.
By documenting supporting evidence, conflicting evidence, and the conditions that would change the interpretation, traders can build a more transparent process. Tools such as AKMelytics can assist that process, while judgment, uncertainty management, and personal risk decisions remain outside the indicator itself.
Frequently asked questions
What is a smart money indicator for TradingView?
It is a TradingView charting tool that presents information related to smart money concepts, market structure, trend, momentum, or institutional activity. It provides context for analysis rather than certainty about future price movement.
Is an institutional flow indicator proof that institutions are buying or selling?
No. An institutional flow feature should be treated as an interpretation of available market information, not direct proof of the identity, intention, or future action of a market participant.
Why might trend and momentum disagree?
Trend and momentum measure different aspects of price behaviour. A market can remain in an established trend while the pace of that move weakens, creating a condition that should be recorded as mixed evidence.
How should conflicting signals be recorded?
Write down the observed conditions, the interpretation they may support, and the evidence that challenges it. Include the timeframe so the disagreement can be reviewed in context.
Can a market structure indicator predict the next move?
No. It may help highlight highs, lows, breaks, or ranges, but those observations do not guarantee what price will do next.
What does AKMelytics – Market Intelligence Indicator cover?
AKMelytics includes features related to trend analysis, momentum, market structure, institutional flow monitoring, multi-timeframe trend assessment, and smart money analysis for TradingView.
Is an indicator financial advice?
No. A trading indicator is a software tool for educational and trading-decision assistance. It does not replace independent judgment or provide personalized financial advice.


Recent Comments