
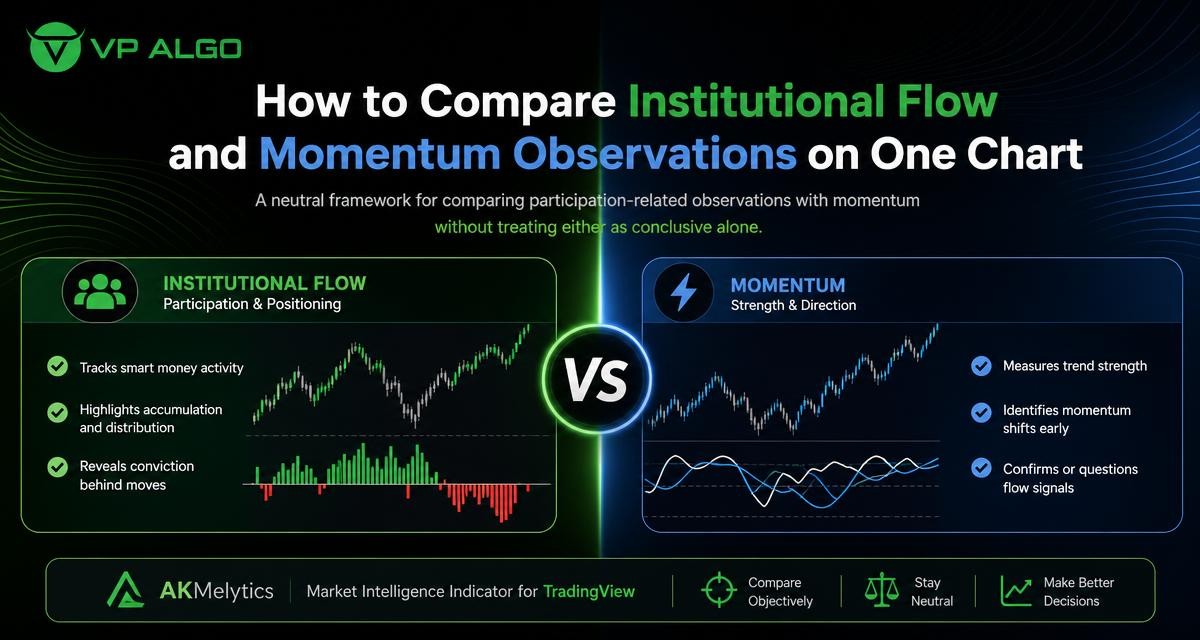
Comparing an institutional flow indicator with momentum on one chart can help traders organize two different market observations: participation-related activity and the speed or strength of price movement. The comparison is most useful when neither observation is treated as a standalone buy or sell instruction. Instead, traders can study whether flow, momentum, price structure, and timeframe context are telling a consistent story.
What institutional flow and momentum are intended to show
An institutional flow observation is generally used to study whether market activity appears to be supporting buying or selling pressure. The term should be interpreted carefully. An indicator cannot automatically prove that a particular institution entered or exited a position, and a visual flow reading is not the same as direct access to every participant’s orders. It is better understood as one analytical representation of participation or pressure.
Momentum focuses on the pace and persistence of price movement. A momentum indicator for TradingView may help a trader assess whether a move is accelerating, weakening, or moving without clear direction. Momentum can remain positive while price is extended, and it can turn negative during a temporary pullback. That is why momentum is more useful as part of a wider reading of trend and market structure than as a conclusive signal by itself.
Why compare both observations on one chart?
Looking at flow and momentum together makes it easier to separate agreement from disagreement. For example, a rising price with supportive participation-related activity and sustained momentum may present a more coherent market narrative than a rising price accompanied by weakening momentum and uncertain flow. This does not make the first situation a guaranteed trade. It simply gives the trader a clearer basis for further analysis.
A single chart also reduces the risk of comparing unrelated timeframes or symbols. When the observations are displayed alongside the same price action, traders can ask practical questions about timing, structure, and confirmation rather than reacting to an isolated line or color.
| Observation | What it may help assess | What it cannot prove on its own |
|---|---|---|
| Institutional flow | Participation-related pressure or a possible change in buying and selling interest | The identity, intention, or future action of a specific market participant |
| Momentum | The pace, strength, and persistence of recent price movement | That the current move will continue or produce a profitable trade |
| Market structure | Whether price is forming higher highs, lower lows, breaks, or ranges | That a structural pattern will develop as expected |
| Trend context | The broader direction visible on the selected or higher timeframe | That every lower-timeframe movement will follow the broader trend |
A neutral framework for reading the chart
The goal is not to award a fixed number of points to each indicator. A more reliable process is to describe what each observation says, identify where they agree, and then investigate the areas where they conflict. This keeps the analysis open to multiple outcomes.
1. Start with price structure
Begin with the price chart before interpreting the indicator panels. Is price forming a sequence of higher highs and higher lows, lower highs and lower lows, or a sideways range? Is the current movement occurring near a recent swing point, inside a consolidation area, or after a sharp expansion?
Structure provides the reference point for both flow and momentum. A positive momentum reading inside a broader range may mean something different from the same reading during a clearly established trend. Similarly, a flow observation near a major structural area may deserve closer review than an identical observation in the middle of an undisturbed range.
2. Record the flow observation without assigning a conclusion
Describe the institutional flow indicator in neutral terms. It may be showing stronger buying-related activity, stronger selling-related activity, a transition, or no clear change. Avoid immediately translating that observation into a trade direction.
Next, compare the timing of the observation with price. Did the flow reading change before a structural move, during the move, or after price had already travelled? Timing matters because a late confirmation can have a different analytical meaning from an early change that is still waiting for price confirmation.
3. Examine momentum separately
After noting flow, assess momentum on its own. Is momentum strengthening in the same direction as price, fading while price continues, or oscillating without a sustained bias? Look for persistence rather than a single bar or isolated change.
Momentum disagreement can be informative without being a reversal signal. If price continues higher while momentum weakens, the chart may be showing reduced acceleration, consolidation, or a possible loss of participation. More evidence is needed to determine which interpretation fits the market structure.
4. Compare the relationship, not just the colors
Many chart tools use colors, labels, or markers to simplify interpretation. Those visual elements can help with scanning, but the underlying relationship is more important. Ask whether flow and momentum are confirming the same direction, measuring different phases of the move, or producing a conflict that calls for patience.
- Agreement: Flow and momentum point in a similar direction while price structure supports the same reading.
- Flow ahead of momentum: Participation-related activity changes, but price momentum has not yet followed.
- Momentum ahead of flow: Price moves quickly while flow remains uncertain or does not visibly confirm the move.
- Conflict: Flow and momentum point in opposite directions, or one is neutral while the other is strong.
- Mixed context: Both observations appear positive or negative, but price is trapped in a range or near a major swing area.
How to interpret common combinations
| Flow observation | Momentum observation | Neutral interpretation |
|---|---|---|
| Supportive or improving | Strengthening | Participation and price movement appear aligned; review structure and location before considering any setup. |
| Supportive or improving | Weakening | Buying-related activity may not be translating into continuing acceleration; watch for consolidation or failed continuation. |
| Uncertain or weakening | Strengthening | Price may be moving faster than participation-related evidence; assess whether the move is early, temporary, or extended. |
| Uncertain or weakening | Weakening | The chart lacks supportive confirmation from both observations; avoid treating this as proof of a reversal. |
| Neutral | Neutral | There may be no clear directional edge from these observations; range conditions or waiting may be more appropriate for analysis. |
When both observations agree
Agreement can make a market narrative easier to explain. Suppose price is forming higher lows, a flow reading appears supportive, and momentum remains firm. The three observations are broadly consistent. A trader can then examine the quality of the structure, nearby areas where price previously reacted, and whether the move is already extended.
Agreement should still be treated as confirmation of an analytical scenario, not a prediction. Indicators can respond to the same historical price data, which means several positive readings may not represent independent evidence. The chart still needs a defined invalidation idea and a realistic assessment of risk.
When flow improves but momentum weakens
This combination deserves careful attention because it can be easy to interpret positively without considering the loss of acceleration. The market may be absorbing selling pressure, consolidating before another move, or failing to attract enough follow-through. Price structure can help distinguish these possibilities, but it cannot remove uncertainty.
Rather than assuming that flow will eventually force price higher, mark the relevant swing area and observe what price does next. A continued hold above structure is a different development from a break back into the prior range.
When momentum strengthens but flow does not confirm
Fast price movement can occur before a participation-related observation changes. It can also occur because of short-term volatility, a reaction to a known event, or a move that later loses support. The absence of confirmation is not proof that the move is invalid, but it is a reason to avoid presenting momentum alone as evidence of institutional participation.
In this situation, traders may review whether the move is breaking a meaningful structural level, whether momentum persists across additional bars, and whether the higher timeframe agrees with the short-term reading.
When both observations weaken
Weak flow and weakening momentum can indicate that the current move is losing support, but several outcomes remain possible. Price may pause, reverse, or simply move sideways before the next directional phase. A trader should not convert a lack of confirmation directly into a reversal call.
This is especially relevant after an extended move. A decline in momentum may reflect normal cooling rather than a complete change in direction. The broader trend and the location of price remain important.

Using multiple timeframes without creating confusion
A multi-timeframe review can add context, but it works best when each timeframe has a clear role. A higher timeframe can be used to describe the broader trend and major structure. The working timeframe can be used to compare flow and momentum in the area being studied. A lower timeframe, if used, can help examine the detail of a move rather than override the larger context.
For example, a short-term positive momentum reading may occur inside a higher-timeframe decline. That does not make the short-term reading useless; it simply changes the question. Instead of asking whether the reading proves a new long-term trend, the trader can ask whether it represents a countertrend phase, a recovery toward resistance, or the early stage of a structural change.
Practical steps for comparing indicators on TradingView
- Choose one symbol and a defined chart timeframe. Avoid changing the symbol or timeframe while forming the initial observation.
- Mark visible structure first. Note the current trend, range boundaries, recent swing points, and areas where price changed direction.
- Add the institutional flow observation. Record whether it appears supportive, negative, changing, or unclear without calling it a trade signal.
- Add the momentum indicator for TradingView. Review direction and persistence rather than focusing on a single reading.
- Classify the relationship. Label the chart as aligned, flow-led, momentum-led, conflicting, or neutral.
- Check a broader timeframe. Ask whether the local observation agrees with or runs against the wider structure.
- Define what would change the interpretation. A structural break, failure to hold an area, or renewed momentum may be more useful than a prediction.
- Document the observation. A brief chart note can reveal whether the same interpretation remains valid after price develops.
Common mistakes to avoid
Treating “institutional” as certainty
The label institutional flow can sound more precise than the available evidence supports. Use it as a description of an indicator-based observation, not as proof of a confirmed institutional order or intention. This distinction helps prevent excessive confidence.
Counting every indicator as independent confirmation
Several tools may be derived from related price information. If flow, momentum, and trend readings all change after the same price movement, they may be describing different aspects of one event rather than providing three unrelated confirmations.
Ignoring location and structure
A bullish reading in the middle of a range is not automatically equivalent to a bullish reading after price confirms a meaningful structural change. Likewise, a bearish momentum reading during a normal pullback does not automatically establish a new downtrend.
Using the chart to predict instead of test a scenario
A better question is, “What would support or weaken this interpretation?” This encourages traders to observe how price behaves rather than forcing every indicator change into a predetermined narrative.
Where AKMelytics can fit into the review process
AKMelytics – Market Intelligence Indicator is presented by VP ALGO TRADING as a TradingView market intelligence tool for traders who want a structured way to review market conditions. In a workflow focused on institutional activity, momentum, trend, and market structure, the product can be considered as part of the chart-reading process rather than as a replacement for judgment.
Users should evaluate any indicator according to how clearly it communicates its observations, how well those observations fit the trader’s process, and whether the trader can define the limits of the information. VP ALGO TRADING positions its indicators for educational and trading-decision assistance purposes, not as financial advice. Any chart interpretation remains uncertain, and traders should make their own decisions about risk and suitability.
A simple checklist before drawing a conclusion
- What is the current price structure?
- What exactly is the institutional flow indicator showing?
- Is momentum strengthening, weakening, or simply fluctuating?
- Are the two observations aligned or in conflict?
- Is the chart in a trend, a range, or near a structural transition?
- Does a higher timeframe support the same interpretation?
- What future price behavior would challenge the current view?
This checklist keeps the comparison descriptive and testable. It also makes it easier to distinguish an observation from a decision. The chart can show a relationship between flow and momentum, but it cannot remove market uncertainty or guarantee a particular outcome.
Frequently asked questions
What is an institutional flow indicator?
An institutional flow indicator is a chart-based tool used to represent participation-related buying or selling pressure. It should not be treated as direct proof of a specific institution’s orders, identity, or future intentions.
Is momentum confirmation enough to enter a trade?
No. Momentum describes the pace or strength of price movement, but it does not by itself confirm market structure, continuation, or a suitable risk level. It is better evaluated with price context and a defined invalidation idea.
What does it mean when flow and momentum disagree?
Disagreement means the two observations are describing different conditions. The market may be transitioning, consolidating, or producing a short-term move without broader confirmation. It is a prompt for further review, not automatic proof of a reversal.
Can I compare these observations on one TradingView chart?
Yes. Placing price structure, an institutional flow observation, and a momentum indicator for TradingView in the same chart layout can make their timing and relationship easier to review. Keep the interpretation tied to the selected timeframe.
Should a higher timeframe always override a lower timeframe?
Not necessarily. A higher timeframe provides broader context, while a lower timeframe can show shorter-term developments. The key is to understand whether the lower-timeframe movement is aligned with, counter to, or neutral within the broader structure.
Can AKMelytics guarantee a profitable trading decision?
No. AKMelytics and other indicators provide observations that may assist analysis, but they cannot guarantee profits or eliminate trading losses. Traders remain responsible for evaluating risk, suitability, and uncertainty.


Recent Comments