
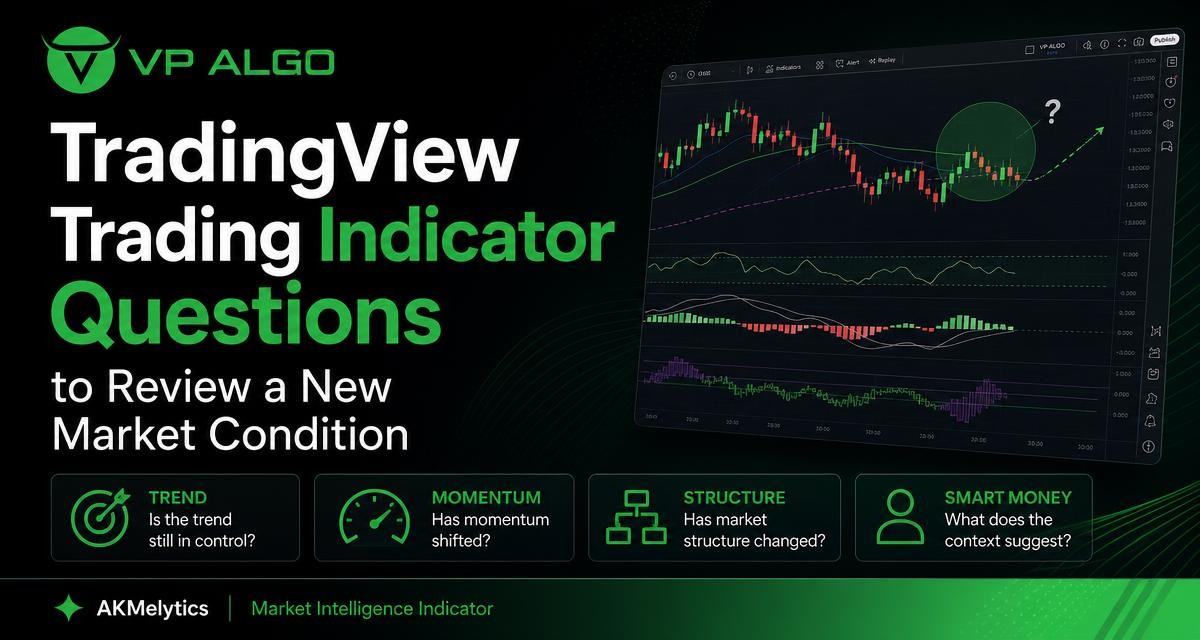
A TradingView trading indicator can help organise a chart review, but its readings should always be interpreted in the context of current market conditions. When a chart no longer resembles the one reviewed earlier, the right response is not to force the old conclusion. Reassess the trend, momentum, market structure and smart money context in a consistent order before considering whether a trading setup still makes sense.
Why a New Market Condition Requires a Fresh Review
Markets can move from a directional trend into a range, from steady momentum into a sharp reversal, or from orderly price action into a volatile and uncertain phase. A setup that appeared clear during one condition may become less reliable when the underlying structure changes. This is one reason stock technical analysis should be treated as a process of observation rather than a single signal.
Reviewing a chart again does not mean discarding every previous observation. It means separating information that may still be relevant from information that depended on an earlier structure. The question is not simply whether an indicator has changed colour or produced a new marker. The more useful question is whether several parts of the market picture still agree.
The Core Questions to Ask Before Reading a Signal
Before examining a possible entry or exit, establish what has changed. A short checklist can prevent a trader from looking only for confirmation of an earlier view.
- Has the broader trend continued, weakened or reversed?
- Is momentum supporting the current move or fading as price extends?
- Has price broken an important structural level?
- Is the market forming a range rather than a directional move?
- Does activity suggest participation around important price areas?
- Do higher and lower timeframes tell a similar story?
- What evidence would invalidate the current interpretation?
These questions are useful whether the chart is being reviewed manually or with a TradingView trading indicator that combines several analytical inputs. They encourage a complete assessment instead of treating one alert, line or marker as a decision by itself.
1. Has the Trend Actually Changed?
Trend is usually the first condition to reassess because it provides the directional context for the rest of the chart. A market may still be moving upward on a shorter timeframe while the larger trend has become neutral or bearish. Conversely, a temporary pullback can look like a reversal before the broader structure has genuinely changed.
Questions for trend assessment
- Are price swings still making higher highs and higher lows, or lower highs and lower lows?
- Has price moved beyond a level that previously protected the trend?
- Is price holding above or below the trend references used in the original review?
- Has the move become too extended for the original continuation idea?
- Does the higher timeframe support the direction seen on the working timeframe?
A trend indicator for TradingView can help make directional conditions easier to monitor, particularly when a chart contains several timeframes or a large amount of price data. However, the indicator reading should be considered alongside swing structure and important levels. A change in a trend display may be an early warning, confirmation of a structural break or simply a response to short-term volatility.
Distinguishing a pullback from a reversal
A pullback temporarily moves against the prevailing direction, while a reversal changes the sequence of price movement. The distinction cannot be established from one candle alone. Look for a meaningful break, the behaviour that follows the break and whether price can reclaim the level that was lost.
If the market has not confirmed a new direction, it may be more accurate to describe the condition as uncertain. That wording matters because it prevents a trader from converting incomplete evidence into a confident directional bias.
2. Is Momentum Confirming the Move?
Momentum describes the strength and pace behind a price move. Price can continue rising while momentum weakens, or it can remain in a broad range while short bursts of momentum appear in both directions. A momentum indicator for TradingView may help identify acceleration, deceleration or divergence, but it does not remove the need to interpret price location.
Momentum questions to include in the review
- Is momentum increasing in the same direction as the trend?
- Are successive pushes producing less progress?
- Is a momentum reading occurring near support, resistance or the middle of a range?
- Has momentum reversed before price structure confirmed a reversal?
- Is the signal visible on one timeframe only?
Momentum is often most informative when combined with structure. Strong momentum through a well-defined resistance level may provide a different context from strong momentum directly into that same level. Likewise, weakening momentum during a controlled pullback is not automatically bearish if the broader structure remains intact.
When the chart no longer resembles the earlier review, compare the current momentum behaviour with the previous phase. Ask whether the market is moving with greater urgency, losing participation or alternating rapidly. This comparison can reveal a condition change before a conventional trend reading fully adjusts.
3. What Does Market Structure Say Now?
Market structure refers to the way price forms swing points, breaks levels and reacts around areas of interest. It gives a framework for assessing whether a move is continuing, failing or consolidating. A market structure indicator can support this review by helping traders track breaks and shifts, but the levels still need to be understood in relation to the chart.
Structure questions for a changed chart
- Which swing high or swing low was most important in the previous analysis?
- Has that level been broken with follow-through?
- Did price close beyond the level, or only briefly trade through it?
- Was the break followed by acceptance or a quick rejection?
- Is the market creating a new range after the break?
- Where would the current interpretation be invalidated?
A structural break can mean different things depending on where it occurs. A break in the middle of a noisy range may carry less directional information than a break from a clearly established pattern. A failed break can also be significant because it shows that price could not maintain acceptance beyond a key area.
Rather than labelling every movement as a trend change, map the most recent meaningful swing points first. Then compare the current price position with those points. This creates a more stable basis for stock technical analysis than reacting to every short-term fluctuation.
4. Is the Market Trending or Ranging?
Many indicator misunderstandings occur when a tool is used without identifying the market regime. Trend-following readings may be easier to interpret during a persistent directional move, while repeated directional signals can become difficult to use when price is moving between support and resistance.
| Market condition | What to examine | Common review question |
|---|---|---|
| Directional trend | Swing sequence, pullbacks and continuation strength | Is the trend still making progress? |
| Range | Range boundaries, failed breaks and price location | Is price near an edge or in the middle? |
| Transition | Structural breaks, retests and momentum changes | Has a new condition been confirmed? |
| High volatility | Fast movement, wider reactions and signal stability | Is the apparent signal being distorted by rapid movement? |
Classifying the condition does not predict what will happen next. It helps determine how much weight to give different observations. In a range, a trend reading may change repeatedly without a sustained move. During a transition, conflicting readings may be expected while the market establishes a new structure.

5. What Is the Smart Money Context?
Smart money analysis is commonly used to examine how price behaves around liquidity, significant levels, institutional activity concepts and areas where larger orders may influence movement. It should be treated as context, not proof that a particular group has taken a position.
A smart money indicator can help organise observations related to market structure, potential liquidity areas and changes in participation. When reviewing a new condition, ask whether the current move is supported by a meaningful reaction at an important area or whether price is simply moving through a low-information part of the chart.
Smart money context questions
- Did price react around a previously identified high, low or liquidity area?
- Was an apparent sweep followed by rejection or continuation?
- Did price return to a structural area and hold it?
- Is the move supported by a clear change in market behaviour?
- Are institutional flow concepts being interpreted as context rather than certainty?
These questions are especially useful when a chart has produced a sudden move that does not fit the prior review. A sharp move can represent genuine continuation, a liquidity event, a failed breakout or a temporary imbalance. The surrounding structure and subsequent reaction provide more information than the initial movement alone.
6. Do the Timeframes Agree?
A multi-timeframe review can help separate broad context from immediate price behaviour. The higher timeframe may show a range while the lower timeframe displays a short-term uptrend. Both observations can be correct, but they describe different layers of the market.
Use a consistent sequence. Start with the larger timeframe to identify broad direction, major levels and the current condition. Move to the intermediate timeframe to examine structure and momentum. Use the lower timeframe, if appropriate to the trading plan, to study timing and local price behaviour.
| Timeframe role | Primary purpose | Useful evidence |
|---|---|---|
| Higher timeframe | Define context | Broad trend, major range and significant levels |
| Intermediate timeframe | Assess structure | Swing points, breaks, retests and momentum |
| Lower timeframe | Study local behaviour | Short-term reactions and confirmation of the plan |
When timeframes disagree, do not automatically treat the lower timeframe as a replacement for the higher one. Record the disagreement explicitly. It may indicate a pullback, an early transition or a shorter-term opportunity within a broader neutral condition.
7. How Should You Review Indicator Conflicts?
Trend, momentum, structure and smart money readings will not always point in the same direction. Conflict is information. It may indicate that the market is transitioning, that the chart is inside a range or that one observation is too short-term to carry much weight.
When readings conflict, rank them by context and relevance rather than counting signals. A structural break at a major level may deserve more attention than a minor momentum change. A higher-timeframe range may limit the importance of a lower-timeframe trend. The goal is not to make every tool agree; it is to understand why they differ.
- Write down the broader market condition.
- Mark the most important structural levels.
- Describe momentum as strengthening, weakening or mixed.
- Record any smart money or participation context around those levels.
- Identify what would confirm or invalidate the current interpretation.
- Decide whether the chart is clear enough for the intended trading plan.
This process can make a TradingView trading indicator more useful because it turns visual information into a repeatable review. It also reduces the temptation to search for a single “buy” or “sell” answer when the evidence is mixed.
Building a Repeatable Condition-Change Checklist
A practical checklist should be short enough to use regularly but detailed enough to capture the main change. The following version can be adapted to a personal trading journal.
- Context: What was the previous condition, and what is the current condition?
- Trend: Is the directional structure intact, weakened or reversed?
- Momentum: Is the current move accelerating, fading or alternating?
- Structure: Which levels have held, broken or been rejected?
- Range: Is price near a meaningful boundary or in the middle?
- Smart money context: What happened around liquidity and important zones?
- Timeframes: Do the broader and local views support each other?
- Invalidation: What evidence would show that the interpretation is wrong?
- Decision quality: Is the chart clear enough to follow the existing plan?
Writing the answers before acting can expose assumptions that are easy to miss when scanning a live chart. It also creates a record for later review, allowing traders to examine whether their process responded to genuine condition changes or merely to short-term noise.
Using Indicator Tools Responsibly
VP ALGO TRADING develops and sells TradingView indicators and algorithmic trading tools intended to assist with market evaluation. Its identified Delphi Intelligence Smart Money Indicator includes features related to trend analysis, momentum signals, market structure, institutional flow monitoring, multi-timeframe trend assessment and smart money analysis. These categories can support a structured review, but they do not replace independent judgment or risk management.
The company also offers the AKMelytics – Market Intelligence Indicator as a TradingView-focused service. Before relying on any indicator, understand what its displays represent, how signals are generated and which market conditions may produce conflicting readings. An indicator is best used as part of a defined analytical process rather than as a guarantee of a trading outcome.
VP ALGO TRADING positions its tools for educational and trading-decision assistance purposes, not as financial advice. Traders should assess whether a tool fits their own objectives, experience and approach, and should avoid treating any signal as a promise of profit or protection from loss.
Final Review: When to Wait for More Information
A changed market condition does not always require an immediate new conclusion. Sometimes the most disciplined outcome is to wait until structure, momentum and higher-timeframe context become clearer. This is particularly relevant when price is moving rapidly, signals are conflicting or the chart sits near the centre of a broad range.
Use the checklist to describe what is known, what is uncertain and what would provide confirmation. A TradingView trading indicator can make that information easier to organise, but the quality of the review depends on how carefully the readings are interpreted. The objective is not to predict every move. It is to recognise when the old market description no longer fits and update the analysis accordingly.
Frequently Asked Questions
What is the purpose of a TradingView trading indicator?
It can help display or organise information such as trend, momentum, structure or other market conditions on a TradingView chart. It should support analysis rather than replace a trading plan or independent judgment.
How can I tell whether a trend has changed?
Review the sequence of swing highs and lows, important structural breaks, follow-through after those breaks and the relationship between higher and lower timeframes. One candle or one indicator change is usually not enough on its own.
Why do trend and momentum indicators sometimes disagree?
They measure different aspects of price behaviour. Trend readings may remain positive while momentum fades, or momentum may increase during a short-term move against the broader trend. The disagreement may signal a pullback, range or transition.
What does a market structure indicator show?
Depending on its design, it may help identify swing points, structural breaks, shifts and important price areas. Traders should still evaluate the significance of each level within the broader chart context.
How should smart money concepts be used in a chart review?
Use them as contextual observations about liquidity, significant levels, participation and price reactions. They should not be treated as proof of a specific institution’s position or as a guaranteed signal.
Should all timeframes give the same signal?
No. Different timeframes describe different layers of price behaviour. The important step is to understand the relationship between them and record when a lower-timeframe move conflicts with the broader context.
When is it better to wait instead of interpreting a new signal?
Waiting may be appropriate when the market is highly volatile, structure is unclear, the chart is in a range or the main readings conflict without a clear invalidation level. More information can be preferable to forcing a decision.


Recent Comments