
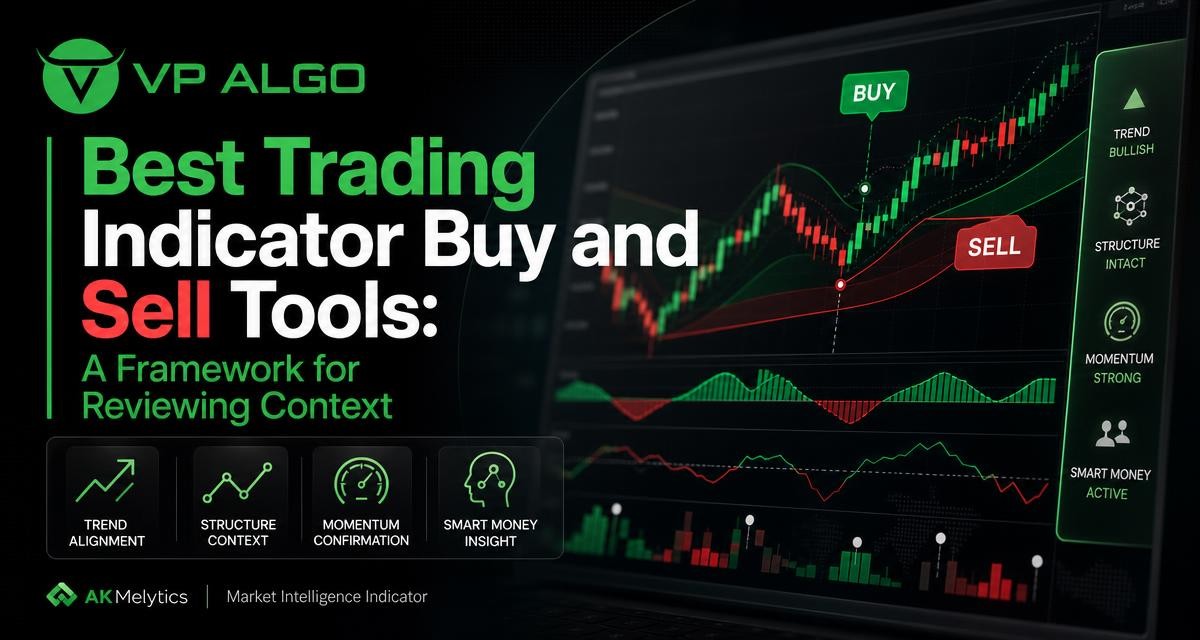
Finding the best trading indicator buy and sell tool is less about locating a display that produces frequent arrows and more about understanding the market context behind each potential setup. A useful indicator should help traders assess trend, momentum, market structure and smart money conditions in a structured way. This framework explains what to review before choosing a TradingView indicator and how the AKMelytics – Market Intelligence Indicator can fit into that process.
Why buy-and-sell signals need context
A buy or sell marker is only one piece of information. It may describe a change in momentum, a break in structure, a trend condition or another calculation based on price data. Without knowing what the signal represents, a trader may treat every marker as an instruction to enter a position, even when the broader market is moving sideways or reacting to a significant level.
Context changes how the same signal should be interpreted. A bullish signal that appears during a sustained uptrend may deserve a different review from one that appears against a declining trend. Similarly, a momentum improvement can be useful confirmation, but it does not by itself explain whether price is approaching resistance, breaking structure or moving through an area where participation may be changing.
For that reason, the best trading indicator buy and sell tools are generally reviewed as decision-support tools. They can help organise information and identify conditions for further analysis, but they do not remove the need for risk management, independent judgment or a defined trading plan.
The four context layers to review
A practical review starts by separating the information an indicator provides into four related layers. These layers can reduce the temptation to focus on a single signal and help traders ask more useful questions about a possible setup.
| Context layer | What to examine | Why it matters |
|---|---|---|
| Trend | Whether price is showing a sustained upward, downward or unclear direction | Helps frame whether a signal aligns with the broader market condition |
| Momentum | Whether price movement is strengthening, weakening or changing direction | Provides information about the energy behind a potential move |
| Market structure | Breaks, shifts, swings and significant areas formed by price action | Places a signal within the sequence of highs, lows and structural changes |
| Smart money context | Signals related to institutional activity, flow or smart money concepts | Adds another perspective on participation and market behaviour |
These layers should not be treated as four independent guarantees. They are different ways of organising market information. A review becomes more meaningful when the layers support a similar interpretation, while conflicting readings may indicate that the market requires more caution or observation.
1. Start with trend analysis
Trend analysis gives a potential buy or sell signal a directional backdrop. A trend indicator for TradingView may help traders assess whether the market is generally moving higher, moving lower or lacking a clear direction. This is particularly useful when a chart contains many short-term price movements that could otherwise appear more significant than they are.
When reviewing a trend component, consider how it behaves across different timeframes. A shorter timeframe may show a temporary reversal while a longer timeframe remains unchanged. That does not automatically make the shorter-term signal invalid, but it does change the type of setup being considered. A trader may be looking at a continuation, a pullback or a counter-trend move, and those situations require different questions.
Questions for assessing trend information
- Does the current direction remain consistent across the timeframes being reviewed?
- Is the market trending clearly, or is the indicator responding to a range-bound condition?
- Does the potential signal appear early in a move, after an extended movement or during a possible transition?
- Does the trend reading agree with the visible sequence of highs and lows?
A trend reading should therefore be used as a filter or context layer rather than as a standalone reason to enter. This approach can help prevent traders from treating every bullish or bearish change as a complete trading thesis.
2. Use momentum to examine participation in the move
Momentum analysis focuses on the strength and pace of price movement. A momentum indicator for TradingView can help identify whether a move is gaining force, losing energy or changing character. This information may support a trend assessment, but momentum and direction are not identical. Price can continue in one direction while momentum weakens, or momentum can increase during a short-lived move.
When buy-and-sell functionality includes momentum information, look beyond the existence of a marker. Examine when it appeared, how long the condition lasted and whether price confirmed the change. A sudden momentum shift near an important structural area may deserve a different review from the same shift in the middle of an unclear range.
How to review momentum signals
- Look for whether momentum is aligned with the current trend or moving against it.
- Check whether the signal is supported by a visible change in price behaviour.
- Consider whether momentum is expanding, fading or simply fluctuating around a neutral condition.
- Review the timeframe so that a short-term momentum change is not mistaken for a broader reversal.
Momentum is most useful when it answers a specific question. For example, a trader might ask whether a pullback is losing force before considering a continuation setup. The indicator does not answer whether the trade will succeed; it helps structure the observation.
3. Examine market structure before acting on a signal
Market structure describes how price forms swings, breaks previous levels and changes its sequence of movement. A market structure indicator can make these events easier to review, especially when a chart becomes difficult to interpret manually. Structure is valuable because it connects a potential buy or sell condition to what price has already done.
A bullish signal after a structural shift may have a different meaning from a bullish signal that appears while price remains below a significant prior swing. The same principle applies to sell signals. A bearish marker may reflect a temporary pullback, a confirmed change in direction or simply noise inside a range. Reviewing the surrounding structure helps distinguish these possibilities for further analysis.
Useful structure questions
- What was the most recent meaningful swing before the signal appeared?
- Has price broken or respected an important structural level?
- Is the signal occurring near a potential support or resistance area?
- Does the current price sequence support continuation, reversal or an unclear interpretation?
Structure should also be considered across more than one timeframe when appropriate. A lower-timeframe break may be important for a short-term setup while remaining minor within the larger trend. Multi-timeframe trend assessment can help place that event into a broader chart narrative.
4. Consider smart money and institutional activity context
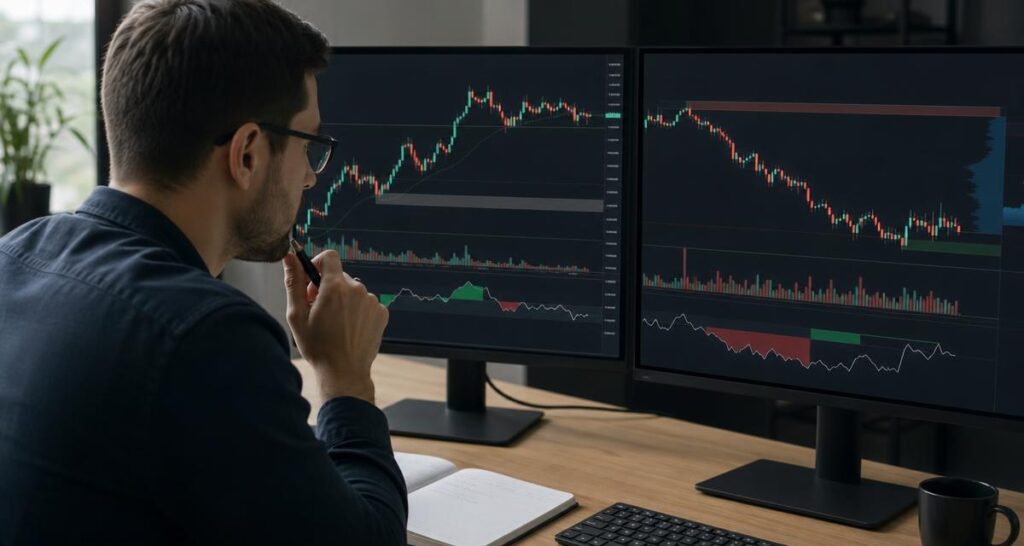
A smart money indicator adds a further analytical perspective by presenting information associated with smart money concepts, institutional activity or institutional flow monitoring. Traders who use this type of tool may be interested in how price behaviour relates to areas where participation appears to be changing.
Smart money analysis should not be interpreted as direct access to every institution’s decisions or as proof that a particular market move must follow. Instead, it can be used as one contextual layer alongside trend, momentum and structure. A smart money signal that agrees with a structural change may provide a more coherent area for review than a signal considered in isolation.
What to review in a smart money indicator
- What information does the indicator display, and how is it intended to support chart analysis?
- Does the smart money context agree with the broader trend or show a possible conflict?
- Is the information presented clearly enough to compare with price action?
- Can the trader distinguish historical context from a newly developing condition?
The goal is not to assume that an institutional flow indicator predicts the next price movement. Its role is to provide another viewpoint that can improve the quality of questions asked during chart review.
What makes a TradingView buy-and-sell tool useful?
When comparing a TradingView trading indicator, evaluate more than the visual appeal of its buy and sell markers. A useful tool should fit the way you analyse charts and should present information that you can understand and apply consistently. If the display creates more confusion than structure, additional features may not improve the review process.
| Review area | What a trader can check |
|---|---|
| Clarity | Can the trader understand what each signal or condition represents? |
| Context | Does the tool show or support trend, momentum, structure and smart money review? |
| Timeframes | Can the information be assessed alongside the trader’s preferred chart timeframes? |
| Workflow | Does it fit into a repeatable process rather than encouraging impulsive entries? |
| Support | Is there a clear way to request help with installation, activation or usage? |
| Expectations | Is the tool presented as decision assistance rather than a guarantee of results? |
These criteria are especially important for beginners. An advanced trader may already have a defined process for structure and momentum, while a newer trader may need a clearer way to organise those concepts. In both cases, the indicator should support analysis instead of replacing it.
How AKMelytics fits this review framework
AKMelytics – Market Intelligence Indicator is offered by VP ALGO TRADING for TradingView. The product is positioned around market intelligence and includes features related to trend analysis, momentum signals, market structure, institutional flow monitoring, multi-timeframe trend assessment and smart money analysis.
That combination is relevant for traders who want to assess buy-and-sell functionality through several layers of context. Rather than reviewing a marker alone, a user can examine whether the surrounding trend, momentum, structure and smart money conditions support the same interpretation. This can make the chart review process more structured, particularly when several signals appear close together.
VP ALGO TRADING also provides assistance with installation, activation and usage after purchase. Customers are instructed to provide their TradingView ID by email for product access and can contact support if they need help using the indicator. The website also offers a request-based 7-day free trial for its indicator and Telegram channel; eligibility and details should be confirmed directly with the company.
A practical review sequence
- Begin with the broader trend and identify whether the market is directional or unclear.
- Review the current market structure and note any recent break or shift.
- Check momentum to see whether the movement is strengthening or weakening.
- Examine smart money or institutional activity context as an additional perspective.
- Compare the readings across relevant timeframes.
- Write down the conditions that would support or invalidate the idea before making a decision.
This sequence does not turn an indicator into a trading system by itself. It provides a repeatable way to inspect the chart and avoid making a decision from one isolated visual cue.
Common mistakes when choosing the best buy-and-sell indicator
Choosing the tool with the most signals
A high number of signals does not necessarily mean that an indicator is more useful. Frequent markers can be difficult to interpret in a sideways or volatile market. The better question is whether the tool helps you understand the conditions behind a signal and apply the same review process consistently.
Ignoring the difference between timeframes
A signal on a short timeframe may conflict with the direction visible on a longer timeframe. That conflict is not automatically a problem, but it should be recognised. Failing to distinguish between timeframes can lead to an unclear plan and inconsistent decision-making.
Using smart money terminology as a guarantee
Terms such as institutional flow and smart money can make an indicator sound authoritative, but they do not guarantee a future market outcome. These concepts should be treated as analytical context and compared with price, trend, momentum and structure.
Expecting an indicator to manage risk
An indicator can help identify conditions for review, but it does not define suitable position sizing, risk tolerance or trade management for every user. Those decisions belong within the trader’s own plan. VP ALGO TRADING positions its tools for educational and trading-decision assistance purposes rather than as financial advice.
Questions to ask before selecting a trading indicator
Before choosing a buy-and-sell tool, write down what you expect it to do. Do you need help identifying trend direction, reading structure, assessing momentum, reviewing smart money conditions or combining several forms of information? A clear objective makes it easier to judge whether a product is relevant.
- Can I explain the meaning of the displayed signals?
- Will the tool fit my existing TradingView workflow?
- Does it help me review more than one market condition?
- Can I use it without treating every marker as an automatic entry?
- Is product access and installation support explained clearly?
- Do I understand that no indicator guarantees profits or removes trading risk?
These questions keep the selection process practical. The best trading indicator buy and sell tool for one trader may not be the right choice for another, because the value of a tool depends on the user’s timeframe, experience, process and ability to interpret the information.
FAQ: Best trading indicator buy and sell tools
What should I look for in the best trading indicator buy and sell tool?
Look for clear signals supported by useful context, such as trend, momentum, market structure and smart money analysis. The tool should fit your TradingView workflow and support a repeatable review process rather than encourage automatic decisions.
Is a buy-and-sell indicator enough to make a trading decision?
No. A marker should be reviewed alongside price action, trend, structure, momentum and your own risk-management plan. An indicator can assist analysis, but it cannot guarantee a result or remove trading losses.
What is a smart money indicator?
A smart money indicator presents information related to smart money concepts, institutional activity or flow monitoring. It can provide additional market context, but it should be compared with other forms of analysis rather than treated as a prediction.
How can a market structure indicator help?
It can help organise information about swings, breaks and changes in the sequence of price movement. This allows traders to review whether a potential signal is aligned with continuation, reversal or an unclear structural condition.
Can a momentum indicator confirm a buy or sell signal?
Momentum information may help assess whether a move is strengthening or weakening. It can support a broader review, but momentum alone does not confirm that a trade will succeed.
What does the AKMelytics – Market Intelligence Indicator include?
The indicator is offered for TradingView by VP ALGO TRADING and includes features related to trend analysis, momentum signals, market structure, institutional flow monitoring, multi-timeframe trend assessment and smart money analysis.
Does VP ALGO TRADING provide financial advice?
No. The company positions its indicators and trading software tools for educational and trading-decision assistance purposes, not as financial advice, investment management or brokerage services.


Recent Comments