
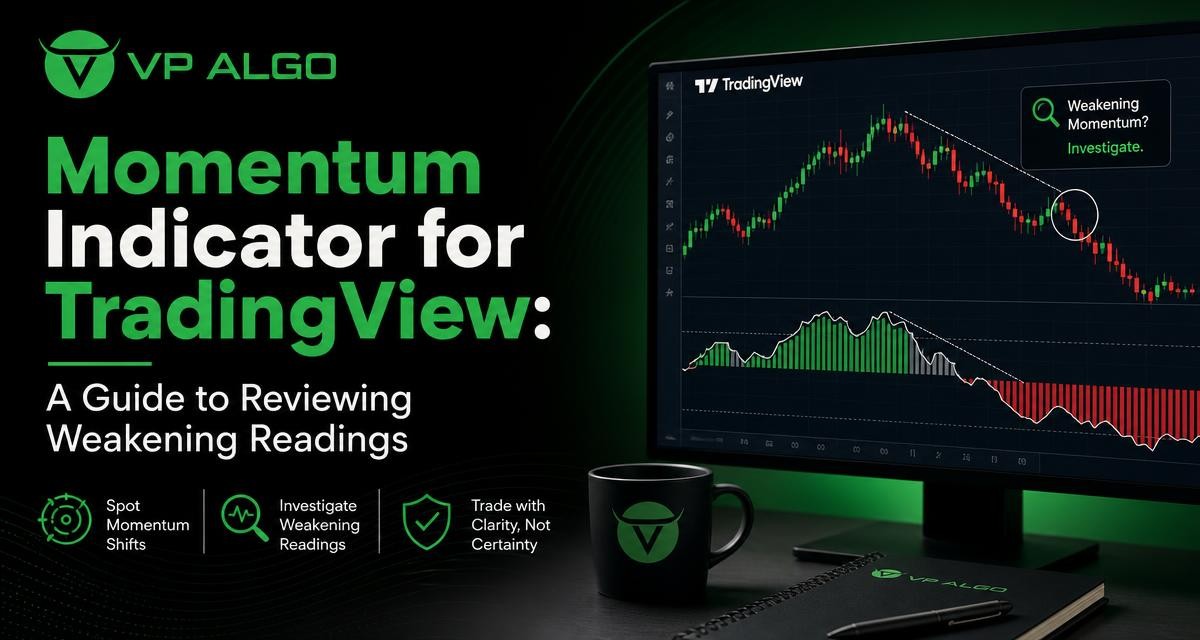
A momentum indicator for TradingView can help traders notice when the strength behind a price move is changing. A weakening reading may prompt a closer review of trend direction, market structure, volume or institutional activity, but it does not automatically confirm a reversal or a sell signal. The useful question is not simply whether momentum has declined, but what the broader market is doing while that decline appears.
What a weakening momentum reading means
Momentum describes the pace and persistence of a price move. When an indicator shows weakening momentum, it generally means that recent price movement is becoming less forceful relative to an earlier period. Price may still be rising while upward momentum fades, or it may still be falling while downward momentum becomes less intense.
This distinction matters because momentum and direction are related but not identical. A market can continue in the same direction after momentum starts to weaken. In some situations, the market pauses, moves sideways or forms a deeper pullback before the original trend resumes. In others, weakening momentum appears alongside a meaningful break in structure. The reading is therefore better treated as an observation that guides further investigation than as a stand-alone conclusion.
Why momentum can weaken before price changes direction
Price often reflects the balance between new buying and selling pressure. During a strong advance, buyers may continue pushing price higher, but the distance covered by each new move can become smaller. The same pattern can occur in a decline when sellers remain active but are no longer extending the move as aggressively.
A momentum indicator may register this change before a visible reversal develops. That early warning can be useful, but early does not mean certain. A market can remain supported by a larger trend, respond to a nearby demand or supply area, or receive new participation that restores momentum. Traders should avoid treating a weakening reading as proof that the market must turn.
Common reasons for weakening momentum
- Profit-taking: traders who participated earlier may reduce exposure after an extended move.
- Consolidation: buyers and sellers may reach a temporary balance, producing a narrower range.
- Approaching market structure: price may be testing a previous high, low, range boundary or other area where reactions have occurred.
- Reduced participation: a move may continue, but with less follow-through than before.
- Timeframe differences: momentum can weaken on a short-term chart while the higher-timeframe trend remains intact.
These possibilities cannot be distinguished from the momentum reading alone. They require context from price action and the timeframes being analysed.
How to review weakening momentum on TradingView
When a momentum signal begins to fade, a structured review can help prevent an automatic reaction. Start with the price chart and ask what has actually changed. Is price still making higher highs and higher lows, or has the sequence become less orderly? In a downtrend, are lower lows and lower highs still developing, or is price beginning to hold above a previous low?
Next, compare the indicator with the market structure visible on the same chart. A weakening reading during a clean trend may simply describe a pause. The same reading after a failed breakout, a sharp rejection or a break of a meaningful swing point may deserve more attention. The indicator adds information; it does not replace the chart.
A practical review sequence
- Identify the current direction. Describe whether price is trending upward, trending downward or moving within a range.
- Locate the momentum change. Note whether the reading is weakening gradually, rapidly, or only on one timeframe.
- Check recent price structure. Review swing highs, swing lows, breakouts, failed breaks and consolidations.
- Mark areas that may influence price. Previous reaction areas and range boundaries can provide useful context without predicting the outcome.
- Compare timeframes. Determine whether the weakening reading is a short-term development inside a broader trend.
- Define what would confirm or invalidate the idea. A trader can set objective observations to monitor instead of reacting to the first signal.
Weak momentum during an uptrend
When an upward trend shows declining momentum, traders may investigate whether the market is pausing or losing directional control. The first consideration is whether the price structure still supports the trend. Higher highs and higher lows may indicate that the larger upward sequence remains present, even if the latest advance is less forceful.
Other questions can make the review more precise. Has price reached a prior high or a range boundary? Did a breakout hold, or did price quickly return to the earlier range? Are pullbacks shallow and controlled, or are they becoming deeper? A weakening momentum reading becomes more informative when it agrees with changes in structure, but it still does not establish that a reversal will follow.
What traders may investigate
- Whether the latest high was accepted or rejected by the market.
- Whether a pullback is holding above a prior swing low.
- Whether the trend indicator for TradingView still shows the same broader direction.
- Whether the market is compressing before another expansion.
- Whether other timeframes show strength, neutrality or weakness.
For example, an indicator may weaken while price remains above a sequence of rising swing lows. That combination may describe slowing progress rather than a confirmed trend change. A break below a significant swing low would be a separate price event that deserves its own assessment.
Weak momentum during a downtrend
Weakening downside momentum can occur when sellers are still controlling direction but are achieving less follow-through. Price may continue to make lower lows, yet each extension may become smaller or less persistent. Alternatively, price may begin to hold above a previous low and spend more time moving sideways.
Traders reviewing this situation may examine whether the market has reached a previous support area, whether a breakdown was rejected, and whether lower highs continue to form. A weakening reading alone does not demonstrate that buyers have taken control. It may reflect a temporary pause before another decline, especially if the broader structure remains bearish.
Weakening momentum in a range
Momentum readings can be particularly difficult to interpret inside a range. Price may alternate between upper and lower boundaries without establishing a durable trend. A momentum decline near the middle of the range may offer limited information because there is no clear directional structure to support the reading.
Near a range boundary, however, traders may investigate whether price is rejecting the area or breaking beyond it with follow-through. The distinction between a temporary move outside the range and a sustained acceptance beyond it is important. A momentum indicator can help describe the strength of the move, but the chart still needs to show how price behaves around the boundary.
| Market situation | What a weakening reading may prompt traders to review | What it does not prove |
|---|---|---|
| Uptrend | Higher lows, breakout follow-through and the depth of the latest pullback | That a reversal must occur |
| Downtrend | Lower highs, support reactions and whether sellers are extending new lows | That downside risk has ended |
| Range | Position within the range and behaviour at its boundaries | That price will move to the opposite boundary |
| Multi-timeframe conflict | Whether short-term weakness is occurring inside a stronger higher-timeframe trend | That one timeframe is automatically more reliable for every decision |
Comparing momentum with trend and market structure
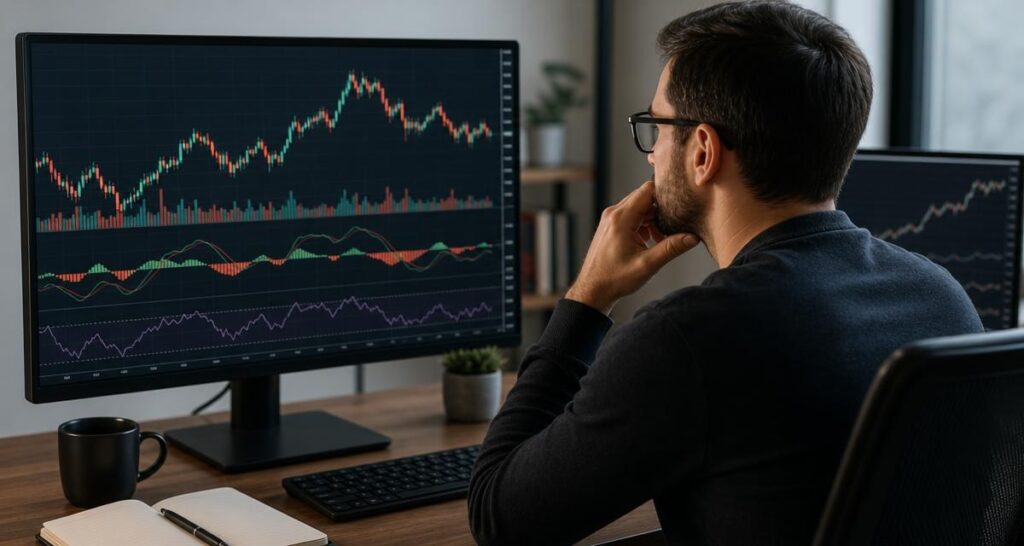
A momentum indicator answers a different question from a trend indicator for TradingView. Momentum focuses on the pace or force of a move, while a trend tool is generally used to assess directional bias. Market structure adds another layer by examining the sequence and significance of highs, lows and breaks.
These tools can disagree without one of them being defective. Momentum may fade while trend direction remains upward. A trend indicator may continue to show a bearish bias while momentum improves during a countertrend rally. Rather than forcing agreement, traders can record the disagreement and identify which price event would provide more information.
| Area of review | Useful question | How it supports analysis |
|---|---|---|
| Momentum | Is the current move gaining or losing force? | Highlights a change in the pace of price movement |
| Trend | What is the prevailing directional bias on this timeframe? | Provides context for interpreting a pullback or continuation |
| Market structure | Are important highs and lows still being respected? | Shows whether the price sequence has materially changed |
| Participation or flow | Is there evidence of changing activity that deserves review? | Adds context without guaranteeing the next price move |
Using multiple timeframes without creating confusion
Reviewing more than one timeframe can help separate a short-term loss of momentum from a broader change in direction. For instance, a lower timeframe may show fading momentum during a pullback, while a higher timeframe continues to display a series of higher lows. That is not a contradiction; it is a difference in scale.
A practical approach is to assign each timeframe a clear purpose. A higher timeframe can provide broad context, an intermediate timeframe can show the current structure, and a lower timeframe can help examine recent price behaviour. The exact chart intervals depend on the trader’s method. The important point is to avoid combining multiple signals without knowing what question each timeframe is intended to answer.
How a market intelligence indicator can support the review
A market intelligence indicator can bring several areas of chart review into one workspace. VP ALGO TRADING develops and sells TradingView indicators and algorithmic trading tools, including AKMelytics – Market Intelligence Indicator. Traders considering such a tool can use it as part of a process for reviewing momentum, trend, market structure and related market conditions.
The indicator should be treated as decision-support and educational software, not as a substitute for independent analysis. A displayed weakening signal still requires the trader to inspect price, timeframe, market structure and risk. No indicator can remove uncertainty or establish that a particular trade will produce a desired result.
Questions to ask when reviewing an indicator
- What does the signal measure, and on which timeframe?
- Does the reading change while a candle is still forming?
- How does the signal behave in trends compared with ranges?
- What price action would support or challenge the initial observation?
- Can the trader explain the signal without relying on a prediction?
Common mistakes when momentum weakens
Assuming every decline means a reversal
Momentum naturally changes during consolidations and pullbacks. Treating every decline as a reversal can lead to premature decisions. Look for a meaningful change in price structure or other evidence before assigning greater significance to the reading.
Ignoring the timeframe
A short-term weakening signal may be normal within a longer-term trend. Comparing timeframes can help identify whether the signal reflects a local move or a broader development.
Using too many indicators without a process
Adding more tools does not necessarily improve analysis. If several indicators measure similar price behaviour, they may create the appearance of confirmation without adding independent information. Define the role of each tool and focus on how it changes the questions being asked.
Entering or exiting solely because of one reading
A momentum signal can be useful as a prompt for investigation, but it does not determine position size, stop placement or whether a trade is appropriate. Those decisions require a complete method and an understanding of risk.
A disciplined checklist for weakening momentum
Before acting on a weakening momentum reading, traders can write down a short checklist. This encourages observation before interpretation and helps distinguish a genuine structural change from normal market noise.
- What is price doing now: trending, ranging or transitioning?
- Which swing high or low would show that the current structure has changed?
- Is the momentum change visible on one timeframe or several?
- Is price near a level where reactions have previously occurred?
- Does the trend context support continuation, or is the evidence mixed?
- What information is still missing before a decision can be considered?
This checklist is not a prediction system. Its purpose is to make the review more consistent and reduce the temptation to turn an early warning into a definite conclusion.
Final perspective
A momentum indicator for TradingView can help traders identify when a move is losing pace, but the reading is only one part of technical analysis. The most useful follow-up is to examine price structure, trend direction, range conditions, timeframe context and any relevant activity or flow information.
Weakening momentum may precede a pause, a pullback, continuation or a larger change in direction. Because several outcomes are possible, traders should use the signal to form better questions rather than to assume a predetermined result. Tools such as AKMelytics – Market Intelligence Indicator may support a structured review, while responsibility for interpretation and risk remains with the individual trader.
Frequently asked questions
What does weakening momentum mean on TradingView?
It means the pace or force of recent price movement has declined relative to an earlier period. Price can still move in the same direction after momentum weakens.
Does weakening momentum confirm a reversal?
No. It may prompt traders to investigate a pullback, consolidation or structural change, but a reversal requires additional evidence from price behaviour and context.
Should momentum be reviewed with a trend indicator for TradingView?
Reviewing both can provide broader context. Momentum describes the strength of movement, while a trend indicator can help assess directional bias. They may sometimes give different readings.
Why can momentum weaken while price continues rising?
Price may continue rising with smaller advances, reduced follow-through or a pause in participation. A trend can persist even when its short-term momentum fades.
How do multiple timeframes help interpret a momentum signal?
They show whether weakening momentum is limited to a short-term chart or also appears within the broader market structure. This can help separate a local pullback from a wider change.
Can a market intelligence indicator predict the next market move?
No indicator can establish the future outcome with certainty. A market intelligence indicator can organise information for review, but traders still need independent analysis and risk management.


Recent Comments