
A smart money indicator can be useful when the market does not present a clean trading picture. Instead of forcing a directional conclusion, traders can use information about trend, momentum, market structure, institutional activity, and multiple timeframes to describe what is known, what is uncertain, and what still needs confirmation. This review focuses on that process: using an indicator as a structured observation tool rather than treating it as an automatic answer.
Why quiet markets require a different review process
Strongly directional markets often appear easier to interpret. Price may consistently form higher highs and higher lows, momentum may support the move, and several timeframes may point in the same direction. Quiet or unclear markets are different. Price can move sideways, react sharply to nearby levels, or alternate between short-lived advances and declines without establishing a dependable trend.
In those conditions, the main challenge is not finding more reasons to trade. It is recording the absence of agreement between the available signals. A market structure indicator may show a narrow range, while momentum shifts from positive to negative and a broader trend remains undecided. An institutional flow reading may add context, but it does not automatically resolve the conflict. Good analysis therefore begins with a more modest question: What does the evidence actually support right now?
What a smart money indicator can bring together
A market intelligence indicator is intended to organize several areas of technical observation in one TradingView workspace. The relevant areas include trend analysis, momentum evaluation, market structure, institutional activity, multi-timeframe trend assessment, and smart money concepts. These categories are related, but they answer different questions.
| Market question | Useful area of analysis | What to document |
|---|---|---|
| Is price moving consistently? | Trend analysis | Whether directional movement is persistent, weakening, or absent |
| How much force is behind recent movement? | Momentum evaluation | Whether momentum confirms price action or is losing alignment |
| Where are important breaks or ranges? | Market structure | Recent highs, lows, range boundaries, and structural changes |
| Is there evidence of notable participation? | Institutional activity or flow context | Whether activity supports, conflicts with, or fails to clarify direction |
| Do different chart views agree? | Multi-timeframe assessment | Which timeframe is clear and which remains unsettled |
| Are smart money concepts relevant to the setup? | Smart money analysis | Potential context, not a guaranteed trade outcome |
The value of bringing these areas together is not that every reading will agree. In fact, disagreement can be one of the most useful observations. If trend and momentum point in different directions, that conflict should remain visible in the trading plan rather than being hidden by a single bullish or bearish label.
Questions to ask when trend is not clear
Has price established a sequence?
A directional trend is easier to discuss when price is producing a recognizable sequence of swings. In an unclear market, that sequence may be incomplete. A recent high may exceed an earlier high, but the corresponding low may not confirm a broader change. Alternatively, price may remain inside a range and repeatedly return toward its middle.
When reviewing a trend indicator for TradingView, record the observation without overstating it. “The short-term reading is positive” is more precise than “the market is bullish.” The first statement describes an indicator condition. The second makes a broader conclusion that may not be supported by the larger chart.
Is the apparent trend stable across timeframes?
Multi-timeframe analysis can show why a market feels confusing. A lower timeframe may display a sequence of rising swings while a higher timeframe remains range-bound. Neither view is necessarily wrong; they are describing different portions of the same price movement.
A practical review can separate the timeframes into three categories:
- Aligned: the selected timeframes broadly support the same directional interpretation.
- Mixed: one timeframe suggests movement while another shows a range or opposing structure.
- Unclear: the readings do not provide a sufficiently consistent description.
This classification helps prevent a short-term movement from being mistaken for a confirmed broader trend. It also creates a record that can be compared with later price development without assuming that the original interpretation was certain.
How to use a market structure indicator in a range
Market structure is especially important when price is quiet. A market structure indicator can help a trader mark potential swing points, breaks, and range boundaries, but the interpretation still requires context. A single move beyond a recent high or low may not be enough to describe a durable structural shift.
Distinguish a boundary test from a structural change
In a sideways market, price may repeatedly test the same area. A movement beyond that area can be watched as a possible change, but it should be documented as an observation until the surrounding price action provides more information. Questions include:
- Did price move beyond the prior boundary or merely approach it?
- Was the movement followed by continued acceptance or a return into the range?
- Did the move change the sequence of relevant highs and lows?
- Do momentum and the higher timeframe support the interpretation?
This approach reduces the temptation to label every temporary excursion as a breakout. It also allows a trader to acknowledge that a market can be active without being directionally clear.
Record the range, not just the possible breakout
When traders focus only on a potential breakout, they can overlook the information provided by the range itself. The range may show where price has struggled to progress, where reactions have repeatedly occurred, and where directional conviction has been limited. Recording these features creates a more balanced review.
A useful journal entry might state that price remains between two observed areas, the latest test has not yet produced sustained structural change, and momentum is mixed. That entry is more informative than a forced prediction because it explains the current conditions and identifies what would need to change before the market becomes easier to interpret.
Reading momentum without turning it into a verdict
Momentum evaluation helps answer whether recent price movement has support or is losing force. It should not be treated as a standalone forecast. In quiet markets, momentum can rotate quickly as price moves within a range. A brief positive reading may reflect movement from the lower part of a range toward the upper part rather than the beginning of a sustained trend.
When reviewing a momentum indicator for TradingView, compare the reading with structure and trend. There are several possible combinations:
| Trend context | Momentum context | Reasonable description |
|---|---|---|
| Unclear | Positive but fading | Recent upward pressure exists, but continuation is not established |
| Range-bound | Alternating | Momentum is rotating within a non-directional environment |
| Weak trend | Conflicting | The trend lacks confirmation from recent movement |
| Developing direction | Aligned | Several observations support closer monitoring, not certainty |
The wording matters. “Momentum is aligned with the latest move” records a relationship. “Momentum proves the next move” claims knowledge that the indicator cannot provide. A smart money trading indicator can assist with the first type of statement, while the second should be avoided.
What institutional activity can and cannot explain
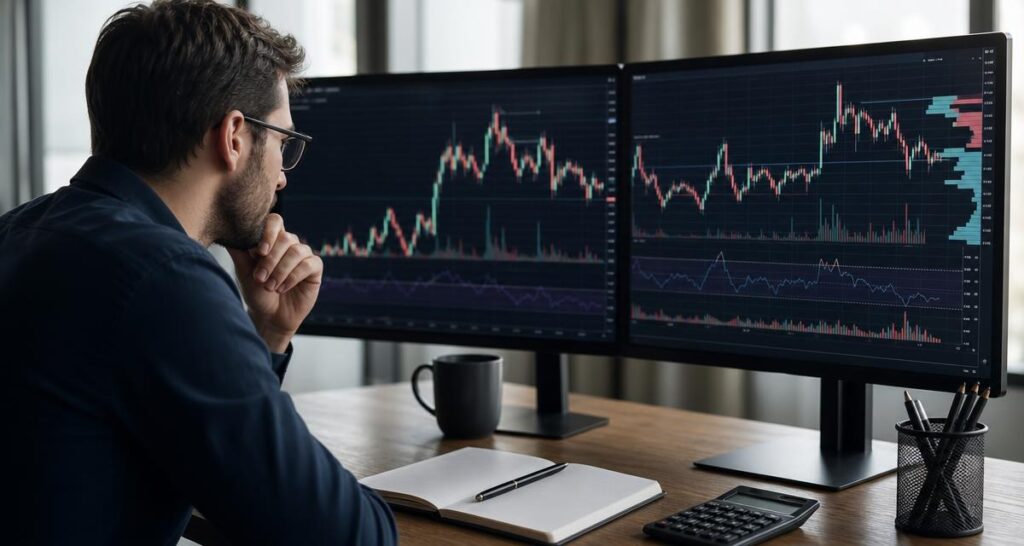
Institutional activity or flow monitoring can add another layer to market review. It may help traders consider whether observed movement appears connected to notable participation or whether the available evidence remains inconclusive. However, a flow-related reading should not be treated as a direct explanation of every price change.
When activity information and price structure agree, a trader may record that the two areas are aligned. When they disagree, the disagreement is itself relevant. For example, price may rise while broader structure remains range-bound, or activity context may appear notable without producing a clear directional move. In either case, the correct response is careful documentation rather than an automatic trade conclusion.
It is also useful to separate three statements:
- Observation: a reading or pattern is present on the chart.
- Interpretation: the reading may support or conflict with the current market structure.
- Decision: a trader chooses whether to continue monitoring, wait, or apply a separate strategy and risk process.
A market intelligence indicator can support the first two steps. The final decision remains the trader’s responsibility and should not be confused with financial advice or a guaranteed result.
A practical uncertainty worksheet
One of the most useful ways to review an unclear market is to use the same questions each time. Consistency makes it easier to compare observations across charts and sessions. It also discourages changing the interpretation simply because the latest candle looks more interesting.
| Review area | Question | Example record |
|---|---|---|
| Trend | Is directional movement persistent? | Short-term direction present; higher timeframe remains range-bound |
| Structure | Has the sequence of highs and lows changed? | Boundary tested, but no sustained structural change observed |
| Momentum | Does recent movement have continuing force? | Positive reading is weakening and not fully confirmed |
| Activity | Does activity context clarify the move? | Activity context is notable but direction remains unresolved |
| Timeframes | Which chart views agree? | Lower timeframe differs from broader structure |
| Conclusion | What is the level of uncertainty? | Conditions require observation rather than a forced directional label |
This worksheet does not need to produce a buy or sell signal. Its purpose is to make the reasoning visible. If the conclusion is “unclear,” that is a valid analytical result. A trader can then define what evidence would make the market clearer, such as a sustained structural shift, renewed momentum alignment, or agreement across selected timeframes.
Where the AKMelytics market intelligence indicator fits
The AKMelytics – Market Intelligence Indicator is positioned for traders who want a structured view of several market conditions in TradingView. Its relevant scope includes trend analysis, momentum signals, market structure, institutional flow context, multi-timeframe trend assessment, and smart money analysis.
For an unclear market, the most useful role is not to replace the trader’s judgment. It is to make several observations easier to review together. A trader can use the available readings to ask whether the market is aligned, conflicted, or simply too quiet to classify with confidence. That distinction is particularly valuable in a journal, where the objective is to document the reasoning behind a decision rather than to make every chart appear actionable.
As with any trading indicator, the readings need to be interpreted in context. The indicator does not remove market uncertainty, eliminate losses, or guarantee profitable results. VP ALGO TRADING describes its tools as intended for educational and trading-decision assistance purposes rather than official financial advice.
Common mistakes when reviewing unclear conditions
Forcing agreement between conflicting readings
Trend, structure, momentum, and activity do not have to agree at all times. Reinterpreting one reading until it matches the preferred direction weakens the analysis. Record the conflict plainly and explain why it matters.
Calling every movement institutional activity
Not every sharp candle or sudden change has a clear institutional explanation. Activity context should be treated as one part of the review, not as proof of a specific participant’s intention.
Using lower-timeframe movement as a broader conclusion
A small chart can show useful detail, but it can also make ordinary range movement look significant. Always compare the short-term observation with the wider structure before describing the market as trending.
Ignoring the no-trade or wait condition
Analysis is not required to end with a trade. When the evidence is mixed, waiting for clearer conditions can be a deliberate conclusion. The important point is to define what would change the assessment instead of waiting without a plan.
A balanced review framework
A smart money indicator is most useful when it supports disciplined questions. Begin with the broader structure, then review the latest movement, momentum, activity context, and timeframe alignment. Mark which observations agree and which do not. Finally, write a conclusion that reflects the quality of the evidence.
The result should be a decision record, not a promise about what price will do next. Quiet and unclear markets are part of normal chart analysis. By documenting uncertainty rather than disguising it, traders can build a more consistent process for reviewing potential setups on TradingView.
Frequently asked questions
What is a smart money indicator?
A smart money indicator is a charting tool that helps traders review concepts associated with trend, momentum, market structure, institutional activity, and smart money analysis. It provides observations for analysis, not guaranteed outcomes.
Can a smart money indicator identify every market trend?
No. Markets can remain range-bound, conflicting, or too quiet for a clear directional conclusion. The indicator can help organize observations, but it cannot remove uncertainty.
How does a market structure indicator help in a sideways market?
It can help traders document relevant highs, lows, range boundaries, and possible structural changes. A boundary test should still be evaluated with surrounding price action and other forms of analysis.
Should momentum agree with market structure before a trader acts?
Agreement can provide useful context, while disagreement is a reason to review the setup more carefully. There is no universal rule that guarantees a result when indicators align.
What does institutional flow information add to chart analysis?
It can provide additional context about activity, but it should not be treated as a complete explanation of price movement or proof of a future direction.
Is the AKMelytics indicator financial advice?
No. VP ALGO TRADING positions its indicators as tools for educational and trading-decision assistance purposes, not as official financial advice or personalized guidance.
What should a trader do when all readings remain unclear?
Record the uncertainty, identify the evidence that would clarify the market, and avoid forcing a directional conclusion. Continued observation can be a valid part of a trading process.


Recent Comments