
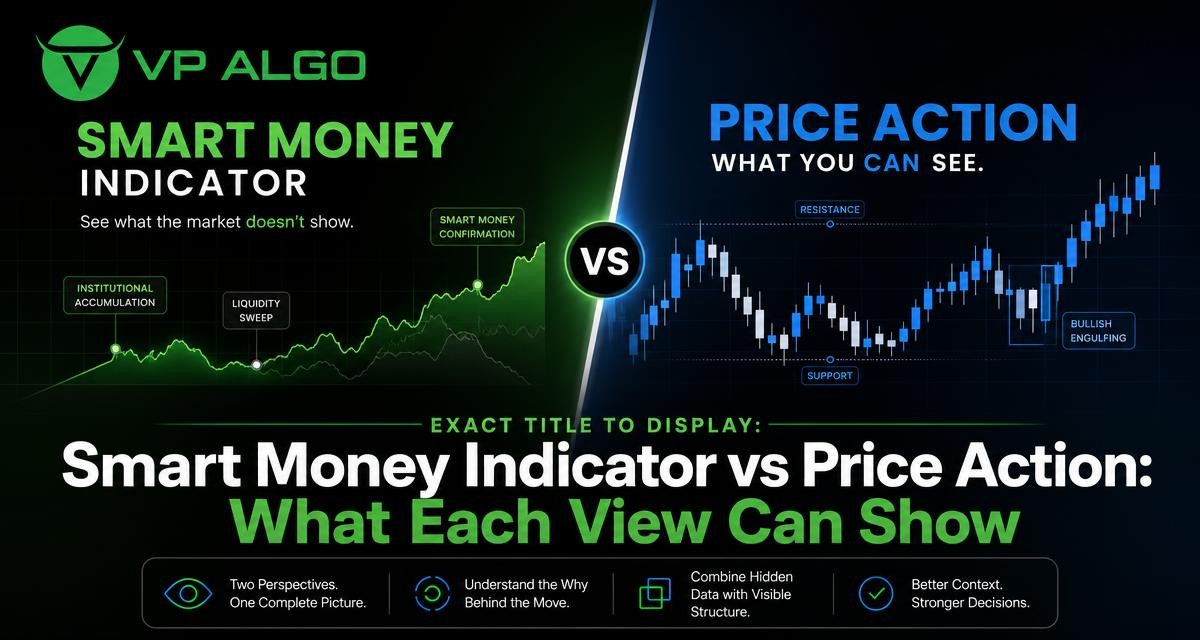
A smart money indicator and price action offer two different ways to study the same market. Price action focuses on what is visible in the chart, such as candle formations, swing highs, swing lows and changes in momentum. Smart money analysis adds a structured view of trend, market structure, momentum and possible institutional activity. Neither perspective needs to replace the other. Used carefully, they can help traders organise market information before considering a trading setup.
What price action shows on a chart
Price action is the direct study of how price moves over time. Traders review the relationship between opening, closing, high and low prices, then place those movements in the context of previous candles and broader market structure. This approach does not require a particular indicator. The chart itself is the primary source of information.
When reviewing price action, a trader may ask whether price is creating higher highs and higher lows, lower highs and lower lows, or a relatively contained range. They may also examine whether a move is accelerating, losing momentum or reacting near a previous area of interest. These observations can be made on different timeframes, although the interpretation may change as the timeframe changes.
The role of candlestick patterns
Candlestick patterns describe the shape and position of individual candles or groups of candles. A long-bodied candle may show strong movement during a period, while a candle with a relatively small body and longer wicks can indicate hesitation or rejection around certain prices. A sequence of candles can provide more context than a single formation in isolation.
However, a candlestick pattern is not a complete trading decision by itself. The same candle shape can have different meanings depending on whether it appears inside a range, after an extended move, near a previous swing point or during a broader trend. Price action is most useful when the candle is read alongside structure, momentum and the location of price.
Strengths and limits of price action
- Strength: It keeps attention on the actual movement of price rather than on a crowded chart.
- Strength: It can be applied across markets and timeframes without requiring a specific indicator.
- Strength: It encourages traders to consider context instead of reacting only to a signal.
- Limit: Interpretation can vary significantly between traders.
- Limit: A busy or rapidly changing chart can make it difficult to organise several observations consistently.
- Limit: A visible pattern does not establish what price will do next.
Price action is therefore a useful foundation, but it can become subjective when the trader has no defined process for identifying trend, momentum, structure and confirmation.
What a smart money indicator can add
A smart money indicator is designed to organise several forms of market information into a more structured chart view. In the context of the AKMelytics – Market Intelligence Indicator, the focus includes trend analysis, momentum evaluation, market structure, institutional activity, multi-timeframe trend assessment and smart money concepts.
This does not mean that an indicator can reveal the private decisions of every institutional participant. Rather, smart money analysis uses observable market behaviour and structured interpretations of price movement to help traders examine conditions that may be associated with larger market participation. The indicator can make these areas easier to review, but the output still requires context and independent evaluation.
Trend and momentum assessment
A trend view helps traders consider the direction in which the market has been moving. Momentum analysis looks at the strength or persistence of that movement. These are related but not identical. Price can remain in an upward trend while momentum begins to weaken, or momentum can increase during a short move inside a broader decline.
By bringing trend and momentum observations together, a TradingView indicator can help separate several situations that may look similar at first glance. For example, a strong candle in the direction of a trend may be different from a strong candle that appears after a prolonged move and near a potential turning area. The indicator does not remove the need to inspect price; it can provide another layer for organising the inspection.
Market structure and possible institutional activity
Market structure refers to the arrangement of important price swings and the way those swings change. A market structure indicator may help highlight developments such as continuation, a break from a prior pattern or a possible change in directional conditions. This can be useful when a trader wants to avoid judging every candle separately.
Institutional flow analysis should be understood carefully. An institutional flow indicator does not provide direct access to the intentions or orders of every institution. It offers an analytical framework based on market information and programmed interpretations. Traders should treat these observations as part of a broader review, not as proof of a guaranteed future move.
Multi-timeframe context
Markets often look different on different timeframes. A shorter chart may show a temporary pullback while a longer chart still displays a broader trend. Conversely, a short-term rally may occur inside a wider declining structure. Multi-timeframe trend assessment can help traders compare these views instead of relying on one chart interval alone.
This comparison is particularly useful when price action appears unclear. A trader can first consider the broader directional environment, then examine the shorter-term structure and momentum. The purpose is not to force every timeframe to agree, but to understand where they differ and what that difference may mean for the level of uncertainty.
Smart money analysis versus price action
The main difference is the way information is presented. Price action is a direct, visual reading of the chart. A smart money indicator adds calculated or organised signals that can draw attention to trend, momentum, structure and smart money-related conditions. One is not automatically more accurate than the other.
| View | Primary focus | What it may help identify | Main consideration |
|---|---|---|---|
| Price action | Visible movement of price | Swing points, candle behaviour, ranges and reactions | Interpretation can be subjective without a defined process |
| Candlestick patterns | Individual candles or candle sequences | Short-term rejection, hesitation or directional pressure | Meaning depends heavily on location and context |
| Smart money analysis | Structured market conditions | Trend, momentum, market structure and smart money concepts | Indicator output should be reviewed rather than followed automatically |
| Multi-timeframe analysis | Relationship between chart intervals | Broader trend versus shorter-term movement | Different timeframes may provide conflicting information |
Why the two perspectives work better together
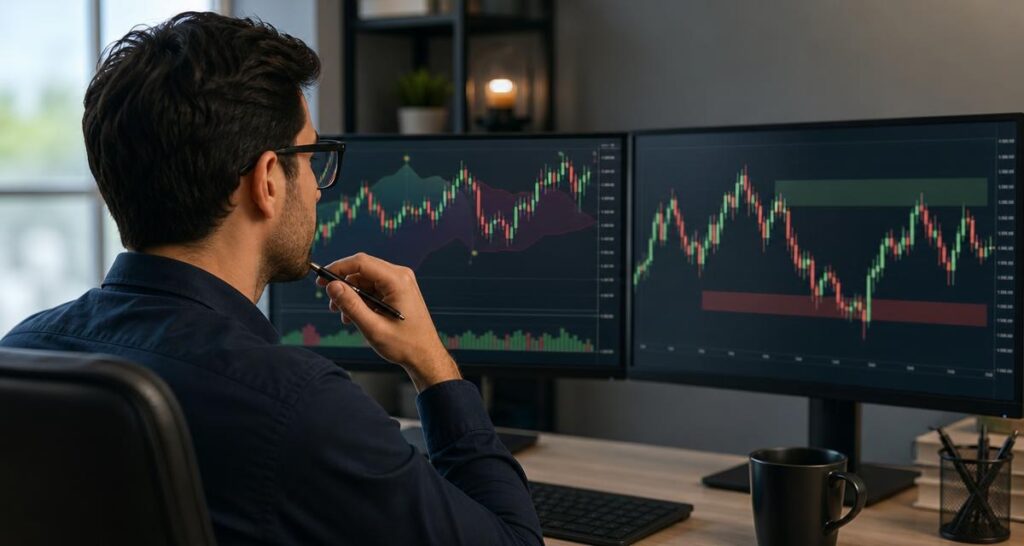
Using price action and a smart money indicator together can create a more complete review process. The indicator may help organise the wider conditions, while the chart provides the visible evidence needed to judge whether a possible setup has meaningful context. This combination can also help reduce the temptation to treat a single candle or label as a complete signal.
For example, a trader might begin by reviewing the broader trend and market structure through the indicator. They could then examine whether the current price action supports that view, whether momentum is consistent with it and whether recent candlesticks show continuation, hesitation or rejection. If the views conflict, the conflict itself is useful information: it may suggest that conditions are mixed rather than clearly aligned.
A practical review sequence
- Start with the broader chart context. Identify the relevant timeframe and review whether the market appears directional or range-bound.
- Review trend conditions. Consider the direction suggested by the broader structure and compare it with the current price location.
- Examine market structure. Look at recent swing highs, swing lows and any apparent change in the previous pattern.
- Assess momentum. Ask whether the current movement is expanding, slowing or moving against the wider direction.
- Read the candles. Use candlestick patterns as supporting evidence, not as isolated instructions.
- Compare timeframes. Check whether the shorter-term movement is consistent with, or contrary to, the broader view.
- Define uncertainty. If the evidence is mixed, record that clearly instead of treating a weak alignment as a strong setup.
This sequence is an analytical workflow, not a promise of a particular trading result. It is intended to help traders make their chart review more consistent and explain why they are considering or rejecting a setup.
Common mistakes when comparing the two approaches
Treating the indicator as a replacement for reading price
An indicator can make information easier to organise, but it cannot remove the need to understand the chart. If a trader follows a plotted label without asking where it appears, what the broader structure looks like or whether momentum supports it, the analysis may become overly dependent on the tool.
Reading a candlestick pattern in isolation
A familiar candle formation may attract attention, but its location matters. A rejection-shaped candle in the middle of a noisy range does not necessarily carry the same significance as a similar candle near a clearly observed swing area. Pattern names can describe what happened without explaining the full market context.
Confusing visual clarity with certainty
A clean chart or a strong-looking indicator display can make a situation feel more certain than it is. Markets can change direction, remain range-bound or produce conflicting signals. Clear presentation is helpful for analysis, but it is not evidence that a future outcome is guaranteed.
Using too many tools at once
Adding multiple indicators can produce more labels without improving understanding. A structured smart money tool may already cover several areas, including trend, momentum and market structure. Combining it with price action can be useful; adding unrelated tools without a clear purpose may make the decision process harder to follow.
How TradingView users can structure their chart review
TradingView users can use a consistent layout to compare the indicator view with the underlying chart. Keep the relevant price candles visible, select the timeframe being reviewed and note the broader timeframe when multi-timeframe context is part of the process. The aim is to make the relationship between price and indicator output easy to inspect.
A simple review record can include the market condition, visible structure, momentum assessment, notable candlestick behaviour and any disagreement between timeframes. Over time, this type of record can show whether the trader is applying the same reasoning consistently. It also helps separate a planned process from a reaction to a single chart event.
| Review question | Price-action observation | Indicator-related observation |
|---|---|---|
| What is the broader direction? | Higher or lower swing sequence, or a range | Trend assessment across the selected timeframe |
| Is movement strengthening? | Candle size, follow-through and speed of movement | Momentum condition or change in momentum |
| Has structure changed? | Recent swing break or failure to continue | Market structure interpretation |
| Do timeframes agree? | Short-term movement compared with the broader chart | Multi-timeframe trend assessment |
| What remains uncertain? | Conflicting candles or unclear location | Mixed signals or lack of alignment |
Where the AKMelytics – Market Intelligence Indicator fits
The AKMelytics – Market Intelligence Indicator is intended to support structured market review on TradingView. Its stated areas include trend analysis, momentum signals, market structure, institutional flow monitoring, multi-timeframe trend assessment and smart money analysis. These functions can help traders bring several observations into one review environment rather than switching between disconnected chart interpretations.
The indicator should be used as a decision-support and educational tool, not as financial advice or an automatic substitute for personal analysis. Traders remain responsible for understanding the conditions shown on their charts and for considering their own approach to risk. No indicator eliminates uncertainty or trading losses.
Which approach should a trader use?
The better question is usually not whether to choose price action or a smart money indicator. It is how much structure the trader needs in order to interpret price consistently. A trader who is comfortable identifying trend, momentum and swing structure manually may use the indicator as an additional confirmation and organisation tool. Someone who finds it difficult to combine those observations may value a more structured chart view.
In either case, the process should remain understandable. A useful approach is one where the trader can explain what price is doing, what the indicator is showing, where the two views agree and where they do not. That explanation is more valuable than simply collecting signals.
Frequently asked questions
What is the difference between a smart money indicator and price action?
Price action studies the visible movement of price, including candles and swing structure. A smart money indicator organises additional observations related to trend, momentum, market structure and smart money concepts. They provide different views of market conditions.
Can a smart money indicator replace candlestick patterns?
It does not need to. Candlestick patterns can show short-term behaviour, while an indicator can provide broader structure and momentum context. Reviewing both may help a trader understand whether a candle is appearing in a supportive or uncertain environment.
Does a smart money indicator show exactly what institutions are doing?
No. It provides an analytical framework based on observable market information and programmed interpretations. It should not be treated as direct access to the intentions or orders of every institutional participant.
How should price action and smart money analysis be combined?
One approach is to review the broader trend and structure first, then examine momentum, recent swings and candlestick behaviour. If the indicator view and price action agree, the context may be clearer; if they conflict, the uncertainty should be acknowledged.
Is the AKMelytics indicator financial advice?
No. It is presented as an educational and trading-decision assistance tool. It does not provide official financial advice, guarantee results or remove the need for independent analysis.
Can different timeframes show different conclusions?
Yes. A shorter timeframe may show a pullback or temporary rally while a broader timeframe shows a different trend. Multi-timeframe review helps traders recognise these differences instead of assuming that every chart interval will align.
What should traders do when the indicator and price action disagree?
They can treat the disagreement as a reason to pause and investigate the context. Reviewing structure, momentum, timeframe alignment and the location of current price may clarify the situation, but no tool can guarantee what happens next.


Recent Comments