
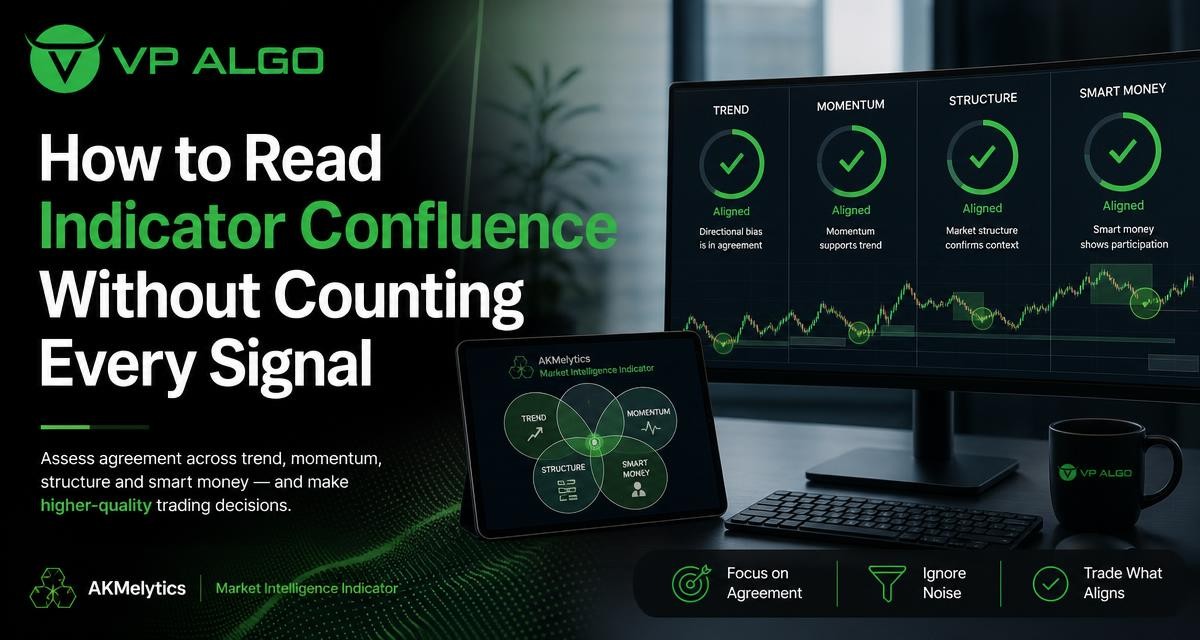
A trading indicator can help organize market information, but a chart becomes more useful when its readings are interpreted together rather than counted mechanically. Indicator confluence is not about collecting as many bullish or bearish signals as possible. It is about asking whether different observations describe the same market condition, whether they come from independent evidence, and whether the setup fits a clear trading plan.
What indicator confluence really means
Confluence exists when several types of analysis point toward a similar interpretation of the market. For example, a trader may see a broader upward trend, a pullback into an important structural area, improving momentum and evidence that buying interest is returning. These observations do not guarantee a trade outcome, but they can create a more coherent market narrative than one isolated signal.
The key distinction is between agreement and duplication. Five indicators may appear to support the same direction while all responding to the same recent price movement. Counting them as five separate confirmations can create false confidence. A better approach is to group evidence by what it tells you: direction, timing, location and participation.
The four questions behind useful confluence
Before examining individual readings, frame the chart with four questions. This keeps technical analysis focused and reduces the temptation to treat every visual element as a new reason to enter.
| Question | What it examines | Typical observations |
|---|---|---|
| What is the direction? | Trend and broader market bias | Higher highs, lower lows, moving direction or multi-timeframe alignment |
| Where is price? | Market structure and location | Swing levels, support or resistance areas, breaks and retests |
| Is the move gaining or losing force? | Momentum and timing | Expansion, contraction, divergence or a momentum shift |
| Who may be participating? | Institutional activity and smart money observations | Displacement, liquidity behavior, order-flow clues or changes around structure |
These categories are more useful than a raw signal total because they describe different dimensions of market behavior. A setup with one clear observation in each category may be more informative than a chart covered with several indicators that all measure trend speed.
Start with trend, but do not let trend decide everything
Trend analysis provides context. It helps answer whether the market has been generally advancing, declining or moving sideways over the timeframe being studied. A trend indicator can support this assessment, but the reading should be compared with price structure rather than accepted without question.
For instance, a trend reading may remain positive after price has begun to form lower highs. That does not necessarily make the indicator wrong; it may simply be slower than the change in price structure. Conversely, a short-term bearish reading can appear during a temporary pullback inside a broader uptrend. The practical question is not whether the trend signal is bullish or bearish in isolation. It is whether the signal matches the timeframe and the structural phase of the market.
Use multiple timeframes as context, not as extra votes
Looking at more than one timeframe can help separate broad direction from short-term movement. A higher timeframe may show an established range while a lower timeframe shows a sharp directional move inside that range. Treating both readings as independent votes can be misleading. They are observations of the same market at different levels of detail.
Instead, assign each timeframe a job. The higher timeframe can define the environment and important areas. The working timeframe can describe the current setup. A lower timeframe, if used, can help examine entry timing. This structure makes it easier to recognize when a short-term signal is only a countertrend movement rather than a complete change in direction.
Read market structure as location and sequence
Market structure explains where price is in relation to previous swings and important areas. It can help distinguish a continuation setup from a reversal attempt. A trading indicator that highlights structure may be useful for organizing these observations, but the trader still needs to consider the sequence of price movement.
Ask whether price is making higher or lower swing points, whether a recent break has held, and whether a retest has occurred in a meaningful area. A directional signal in the middle of an established range may have a different significance from the same signal after a clear structural break and controlled retest. Location changes the interpretation.
Structure is not the same as a single line on a chart
Support and resistance are often treated as exact prices, yet markets can react around zones rather than one perfectly precise level. A structural observation becomes more useful when it considers the surrounding price action, the strength of the move away from the area and whether the level has already been tested repeatedly.
Structure can also conflict with trend readings. That conflict is valuable information. It may indicate a pullback, a developing range or a possible transition. Rather than forcing the readings into a bullish or bearish total, record the disagreement and decide what evidence would resolve it.
Use momentum to assess timing and pressure
Momentum analysis addresses a different question from trend analysis: how strongly is price moving now, and is that pressure increasing or fading? A momentum indicator can help identify acceleration, deceleration or a possible shift in short-term pressure.
Momentum should not be treated as a simple overbought or oversold instruction. Strong momentum can persist, and weak momentum can remain weak during a prolonged move. The more useful interpretation depends on context. Momentum strengthening as price leaves a well-defined structural area may support a continuation idea. Momentum fading while price reaches a major opposing area may call for caution, especially if the broader trend is no longer progressing.
Separate momentum direction from momentum quality
A positive momentum reading does not automatically mean that a move is healthy or well positioned. Consider whether the move has enough room before a nearby structural barrier, whether candles are expanding or overlapping, and whether momentum is supporting a fresh break or merely following an extended move.
When momentum and structure disagree, avoid resolving the conflict by adding another indicator. First determine whether the disagreement is expected. A pullback may show weaker short-term momentum while the broader structure remains intact. That is different from a failed breakout accompanied by weakening momentum and a return through the broken area.
Interpret smart money observations carefully
Smart money analysis is often used to describe observations about liquidity, institutional activity, displacement and the behavior of price around important areas. These concepts can add a participation-oriented perspective, but they should not be treated as direct proof of what a particular institution is doing.
Use smart money observations as part of a broader question: does price behavior support the proposed market narrative? For example, a forceful move away from a structural area may be more meaningful when it changes the sequence of swings and is followed by a controlled retest. A liquidity sweep may deserve attention, but its interpretation depends on what happens afterward. Without follow-through or structural confirmation, the observation may remain ambiguous.
Do not turn labels into certainty
Terms such as order block, liquidity grab or institutional flow can make a chart easier to describe, but labels do not remove uncertainty. The same price action can be interpreted differently depending on timeframe and surrounding structure. Keep the observation specific: price moved beyond a prior swing, rejected the area and then reclaimed a level. That description is more testable than assuming a hidden participant has definitely entered the market.

Why counting signals can create false confidence
Signal counting feels objective because it produces a simple score. However, the score can hide several problems.
- Overlapping inputs: multiple momentum tools may be reacting to the same price change.
- Lagging readings: several indicators may turn bullish only after a large part of the move has already occurred.
- Different timeframes: a lower-timeframe signal can appear to confirm a higher-timeframe signal even though both describe the same move.
- Unclear location: a strong directional reading may occur directly below resistance or above support.
- Confirmation bias: traders may count favorable signals while dismissing information that challenges the preferred direction.
A better method is to classify each observation by function. If three readings all answer “is price moving upward?”, they may represent one trend category rather than three confirmations. If another observation answers “is price at a meaningful structural area?”, it adds a different type of evidence.
A practical confluence framework
The following process can help turn a crowded chart into a structured review. It is an analytical framework, not a promise of a particular result or a substitute for risk management.
- Define the market environment. Decide whether the selected timeframe shows a trend, range or transition. If the environment is unclear, record that uncertainty instead of inventing a directional bias.
- Mark the relevant structure. Identify recent swing points, breaks, retests and nearby areas that could interrupt a move.
- Describe momentum. Note whether pressure is expanding, fading or mixed. Ask whether the momentum behavior fits the location.
- Review participation clues. Examine smart money or institutional activity observations as contextual evidence, not as a guaranteed explanation of market intent.
- Check for conflicts. Write down the strongest bearish and bullish observations. A setup with visible conflict may need more patience or a different interpretation.
- Define invalidation before action. Identify the market behavior that would disprove the idea. This keeps the analysis from changing after the position is taken.
This process replaces “seven signals agree” with a more precise statement, such as: the higher-timeframe environment is upward, price has returned to a structural area, momentum is beginning to improve, and the participation evidence is still incomplete. That description is less exciting than a high score, but it gives the trader something concrete to monitor.
How a trading indicator can support the process
A multi-factor trading indicator can make it easier to view trend, momentum, market structure and smart money observations in one analytical workflow. This can be useful when the goal is to organize information rather than search for an automatic buy or sell answer.
VP ALGO TRADING develops TradingView indicators and algorithmic trading tools, including the AKMelytics – Market Intelligence Indicator. Traders evaluating any such tool should first understand what each displayed component measures, which readings may overlap, and how the tool fits with their own charting process. A clear display can support analysis, but the trader remains responsible for interpreting context, considering risk and deciding whether the evidence is sufficient for their plan.
Questions to ask when reviewing an indicator
- Which parts of the tool describe trend, momentum, structure or participation?
- Are several labels derived from similar price inputs?
- Does the indicator update quickly, or does it confirm after a move is already underway?
- Can the readings be compared across the timeframes used in the trading plan?
- What would count as a failed setup or invalidated market narrative?
Build a confluence checklist that stays simple
A useful checklist should reduce impulsive interpretation, not add another layer of complexity. Keep the categories separate and use plain descriptions. For example, a review might include the following:
| Category | Review question | Example conclusion |
|---|---|---|
| Trend | What is the broader directional condition? | Upward, downward, ranging or unclear |
| Structure | Where is price relative to recent swings and key areas? | At support, near resistance, inside a range or retesting a break |
| Momentum | Is current pressure expanding or fading? | Strengthening, weakening or mixed |
| Participation | Do smart money observations support the price narrative? | Supporting, conflicting or insufficient |
| Risk condition | What would invalidate the idea? | A level break, failed retest or structural change |
Notice that the checklist does not produce a mandatory score. Its purpose is to expose the reasoning behind a decision. If the answers are mixed, that is a valid result. Waiting for clearer conditions can be more disciplined than adding indicators until the chart appears to agree.
Common mistakes to avoid
Using confluence as a guarantee
Agreement across several observations can improve organization, but it cannot remove uncertainty from financial markets. Even a well-structured setup can fail, and technical readings can change as new price information appears.
Adding indicators after every loss
When an analysis fails, adding another filter may feel productive. It can also make the process harder to understand and encourage overfitting. First ask whether the original observation was unclear, whether the location was poor, or whether the invalidation rule was missing.
Ignoring the cost of late confirmation
More confirmation often arrives later. A trader should understand the trade-off between waiting for additional agreement and entering after much of the move has occurred. This is a planning issue, not a reason to prefer fewer or more indicators in every situation.
Confusing a narrative with evidence
A compelling explanation about smart money or institutional activity is not automatically verified by a chart label. Keep interpretations tied to observable price behavior and be willing to mark the evidence as incomplete.
Final perspective
Reading confluence well means understanding what each observation contributes and what it does not prove. Trend provides context, structure provides location, momentum helps describe current pressure, and smart money observations can add a participation-oriented perspective. The strongest analysis is not necessarily the one with the longest list of signals. It is the one that explains how the evidence fits together, acknowledges conflicts and identifies what would invalidate the idea.
Use a trading indicator as an aid for structured analysis rather than as a substitute for judgment. Keep the categories distinct, avoid counting duplicated readings, and make uncertainty part of the process. This approach can make trading technical analysis clearer without pretending that confluence eliminates risk.
Frequently Asked Questions
What is indicator confluence in trading?
Indicator confluence is the agreement of different types of market evidence, such as trend, momentum, structure and participation observations. It does not mean that multiple signals guarantee a successful trade.
Why is counting signals a problem?
Several signals may be based on the same price data or may be lagging versions of one observation. Counting them separately can exaggerate the strength of the evidence and create false confidence.
How should trend and market structure be combined?
Use trend to describe the broader environment and structure to identify price location and sequence. A trend reading should be checked against swing behavior, breaks, retests and nearby structural areas.
What does momentum add to technical analysis?
Momentum helps describe whether current price pressure is strengthening or fading. Its meaning depends on context, including the broader trend and the structural area where the movement occurs.
Are smart money observations proof of institutional activity?
No. Smart money concepts provide a way to interpret liquidity, displacement and behavior around structure, but chart observations do not prove what a specific institution is doing.
Can a TradingView indicator replace a trading plan?
No. An indicator can organize market information, but a trading plan still needs clear conditions, risk controls, timeframes and rules for invalidation. Indicator readings should be treated as decision support, not financial advice.


Recent Comments