
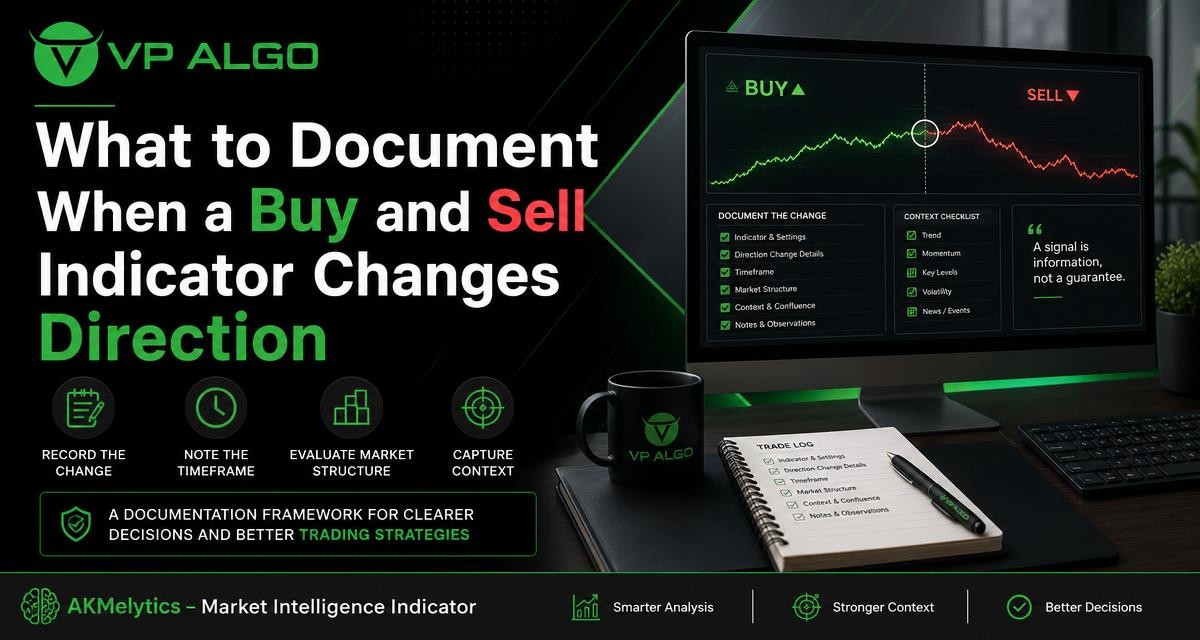
When the Best trading indicator buy and sell direction changes, the signal itself is only the beginning of the analysis. A useful record should show what changed, on which timeframe, how price was behaving, and whether the surrounding market context supported or weakened the indication. This documentation helps traders review decisions more clearly without treating an indicator signal as a guarantee of a particular outcome.
Why changing indications deserve careful documentation
A buy and sell indicator may change direction as new price information appears. A previous buy indication can weaken, disappear, or be replaced by a sell indication. The reverse can also happen. Recording only the final signal leaves out the sequence that produced the change and makes it difficult to understand whether the shift came from a genuine change in market conditions, a move on a lower timeframe, or ordinary market noise.
Documentation is not a way to prove that an indicator was right or wrong in isolation. It is a method for evaluating how an indication fits within a broader process. A journal can help separate the signal from the decision, the market context from the trader’s assumptions, and the original evidence from what became visible later.
The essential information to record
Use the same core fields each time a direction changes. Consistency matters more than creating a complicated template. The following information provides a practical starting point.
| Field | What to record | Why it matters |
|---|---|---|
| Date and time | When the direction changed and when the chart was reviewed | Creates a time-stamped record of the observation |
| Instrument or chart | The market and chart being examined | Keeps each observation connected to the correct chart |
| Timeframe | The timeframe showing the change, plus higher and lower timeframes reviewed | Shows whether the change is broad or limited to one chart view |
| Previous indication | What the indicator showed before the change | Clarifies the direction of the transition |
| New indication | What the indicator shows after the change | Records the current state without assuming a future result |
| Price structure | Relevant highs, lows, ranges, breaks, or failed moves | Places the signal within visible price action |
| Momentum and flow | Whether momentum or institutional-flow information supports or conflicts with the change | Captures the surrounding evidence rather than relying on one display |
| Decision and review | What action was considered, what was actually done, and what will be reviewed | Separates analysis from execution and hindsight |
Record the exact signal transition
Start with a neutral description of the change. For example, note that a buy indication was visible on the previous review and that the chart later displayed a sell indication. If the platform shows a specific marker, color, label, or status, record that detail as it appears. Avoid rewriting the observation as a prediction such as “the market will now fall.” The first statement describes the chart; the second adds an assumption.
It is also useful to record whether the change was immediate or developed over several candles. A direction that changes repeatedly over a short period may indicate a less decisive market environment, while a change that follows a notable structural event may deserve a different review. The journal should document the sequence rather than force every change into a simple success-or-failure category.
Capture the chart before and after the change
When possible, save a chart image or make detailed notes before the old indication is no longer visible. Then record the later chart state separately. These two snapshots can reveal whether price made a new high or low, returned to a previous range, or simply moved sideways while the indication changed.
Do not edit the earlier record to match what happened later. Keeping the original observation protects the review from hindsight bias. If a screenshot is not available, describe the visible price level, candle sequence, and indicator state as precisely as practical.
Document the timeframe and alignment
A direction change has limited meaning until its timeframe is clear. A signal on a short-term chart may change while a higher timeframe still shows a different market structure. Conversely, a higher-timeframe shift may provide important context for several lower-timeframe observations. Neither view should automatically be treated as more certain; they answer different questions about the market.
Record the primary timeframe used for the observation and then check whether higher and lower timeframes agree, conflict, or provide no clear information. A simple alignment note can be enough:
- Higher timeframe: trend, range, or unclear.
- Primary timeframe: previous indication, new indication, and the candle or event associated with the change.
- Lower timeframe: confirming movement, conflicting movement, or no useful additional detail.
This approach prevents a short-term change from being described as a complete market reversal without supporting evidence. It also makes it easier to compare similar situations later when reviewing trading strategies.
Describe market structure around the signal
Market structure provides a framework for describing what price is doing independently of the indicator label. Record the most relevant recent highs and lows, whether price is making higher or lower swing points, and whether it remains inside a range. If price has moved through a level, note whether the move held, failed, or returned into the prior area.
Useful structure notes may include:
- A higher high or lower low was formed before the direction changed.
- Price remained between a recent high and low, suggesting a range-bound condition.
- A break occurred but had not yet been tested or confirmed by subsequent price action.
- Price moved beyond a level and then returned, creating a possible failed break to review.
- The signal changed near a previously identified swing point or consolidation area.
These descriptions do not predict what will happen next. They simply give the signal a structural setting. A market structure indicator may help organize this information, but the journal should still state what was observed on the chart rather than assume that any displayed label explains the entire market.
Record momentum, institutional activity and smart money context
When an indicator includes momentum evaluation, institutional activity monitoring, or smart money analysis, document whether those elements agree with the direction change. The purpose is to identify confluence and disagreement, not to turn several readings into a guarantee.
For example, a journal entry might state that the direction changed from buy to sell while momentum also weakened, or that the new sell indication appeared while the broader trend remained upward. If an institutional-flow or smart money component shows a different condition, record that conflict plainly. A conflicting reading may be more informative than a fully aligned display because it highlights an area requiring closer review.
Use descriptive language instead of certainty
Prefer phrases such as “momentum appeared weaker,” “the readings were mixed,” or “the new indication was not aligned with the higher timeframe.” Avoid phrases such as “institutions are definitely selling” or “the indicator knows the next move.” An indicator can organize information and assist with technical analysis, but it cannot remove uncertainty from trading.
Note the surrounding price and market conditions
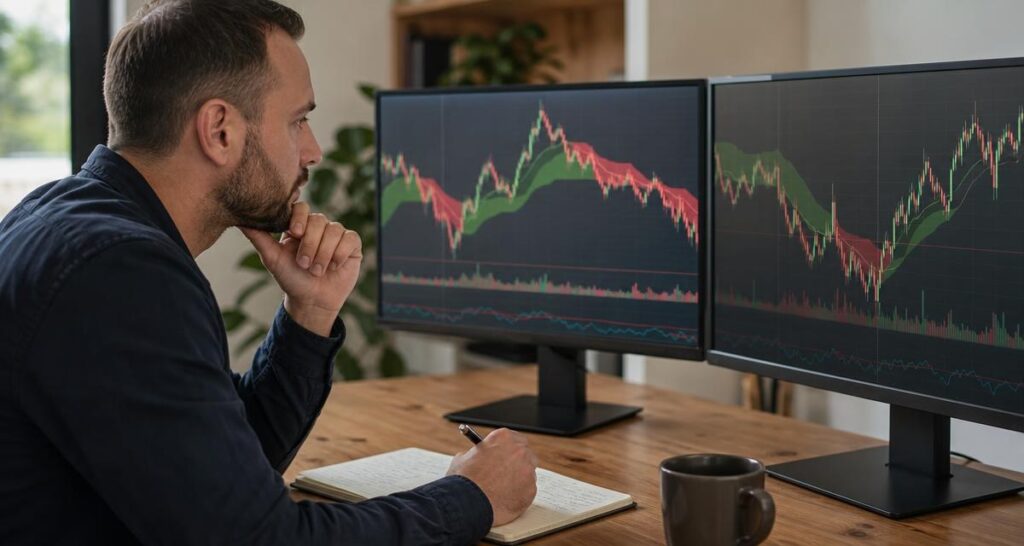
Indicators do not operate in isolation from price behavior. Record what happened around the signal change, including the pace of movement, the size of recent candles, and whether price was trending or moving sideways. If a major chart event was visible, describe it without inventing an explanation that the data does not support.
Also note conditions that may affect interpretation, such as a narrow range, a sudden expansion in movement, or a sharp retracement. The goal is not to create a complete market report for every entry. It is to preserve enough context to answer a later question: “What did the chart look like when this indication changed?”
Separate observation, interpretation and action
One of the most useful improvements to a trading journal is separating facts from conclusions. Use three short sections in each entry:
- Observation: What the indicator and price displayed.
- Interpretation: What the change might mean within the selected trading plan.
- Action: What was considered or done, including the decision to wait.
For instance, the observation could state that the chart changed from a buy indication to a sell indication after price moved below a recent swing low. The interpretation could note that the short-term structure weakened, while the higher timeframe remained unclear. The action could state that no trade was taken until the next review condition was met. This format avoids presenting a personal decision as though it were a direct instruction from the indicator.
Include risk and invalidation notes
Documentation should include the conditions that would make the original interpretation less useful. These are often called invalidation conditions, but they should be defined by the trader’s own plan rather than by an assumption that the indicator guarantees a result.
Examples of useful notes include:
- The higher timeframe does not support the new direction.
- Price remains inside a range and has not established a clear break.
- Momentum and structure provide conflicting information.
- The indication changes again before the planned review point.
- The chart has moved too far from the area originally being evaluated.
Risk notes should also record whether the trade was considered, rejected, delayed, or closed according to a predefined process. Avoid recording only the outcome. A favourable result does not automatically mean the analysis was sound, and an unfavourable result does not automatically mean the process was unreasonable.
A practical documentation template
The following template can be copied into a trading journal and adapted to different charts. Keep the wording factual and complete it at the time of review.
Date and time:
Chart and timeframe:
Previous indication:
New indication:
Price structure:
Higher-timeframe context:
Lower-timeframe context:
Momentum reading:
Institutional-flow or smart money context:
Surrounding price conditions:
Interpretation:
Action considered or taken:
Invalidation or review condition:
Follow-up date:
A template is valuable only when it is used consistently. If a field does not apply, write “not reviewed” rather than filling it with an assumption. Over time, the records can show whether direction changes tend to occur during ranges, after structural breaks, or when different timeframes disagree.
How to review a collection of entries
Review entries in groups rather than judging one indication in isolation. Look for recurring conditions: Did changes happen mostly on one timeframe? Were they more difficult to interpret when price was ranging? Did the journal frequently show disagreement between momentum and market structure? Did decisions become less consistent when several readings changed at once?
These questions can improve the way a trader evaluates a buy and sell indicator. They do not establish a universal best indicator or a guaranteed trading strategy. They help determine whether the tool is being used in a clear, repeatable decision-making process that matches the trader’s objectives and risk controls.
Using a TradingView indicator responsibly
A TradingView indicator such as AKMelytics – Market Intelligence Indicator can be considered within a broader chart-review workflow that includes trend, momentum, market structure, institutional activity, and smart money conditions. The important distinction is between using these features to organize analysis and treating them as automatic trade instructions.
Before relying on any indicator in live decision-making, understand what each displayed element represents, how its readings change, and how you will record conflicting information. Testing a documentation process through historical chart review or a suitable practice environment may help reveal gaps in the workflow. Any trading decision remains subject to market uncertainty and personal risk limits.
Final checklist before closing the journal entry
- Did I record the exact previous and new indications?
- Did I identify the timeframe where the change occurred?
- Did I review higher and lower timeframes?
- Did I describe market structure without turning it into a prediction?
- Did I record momentum, institutional activity, or smart money context when available?
- Did I separate observation from interpretation and action?
- Did I write down conditions that would change my interpretation?
- Did I avoid treating the signal as a guarantee?
A well-documented direction change is not a promise of a better trading result. It is a clearer record of how an indication appeared, how it interacted with market context, and how a decision was made. That clarity can make future reviews more disciplined and more useful.
Frequently asked questions
What should I record first when a buy and sell indicator changes direction?
Record the date and time, chart, timeframe, previous indication, new indication, and the price movement associated with the change. Add interpretation only after documenting what was visibly displayed.
Does a change from buy to sell confirm that the market will fall?
No. It records a change in the indicator’s reading, not a guaranteed future movement. Review market structure, timeframe alignment, momentum, and risk conditions before drawing a conclusion.
Why should I document more than one timeframe?
Different timeframes can show different stages of market movement. A short-term change may occur while a higher timeframe remains in an opposite trend, range, or unclear condition.
How should I document conflicting indicator readings?
State which readings agree and which conflict. For example, note that the new direction is bearish while the higher timeframe remains bullish or momentum is mixed. Do not force the conflict into a single certain conclusion.
Should I record a signal if I do not take a trade?
Yes. Recording signals that were observed but not acted on helps separate chart interpretation from execution and shows whether waiting was part of a consistent process.
Can an indicator replace a trading plan?
No. An indicator can support technical analysis, but it does not define personal risk limits, position decisions, review rules, or financial objectives. Those decisions require a separate plan.
What makes documentation useful over time?
Consistent fields, factual language, chart context, and honest records of both action and inaction make entries easier to compare. Review groups of entries to identify recurring conditions rather than judging one outcome alone.


Recent Comments