
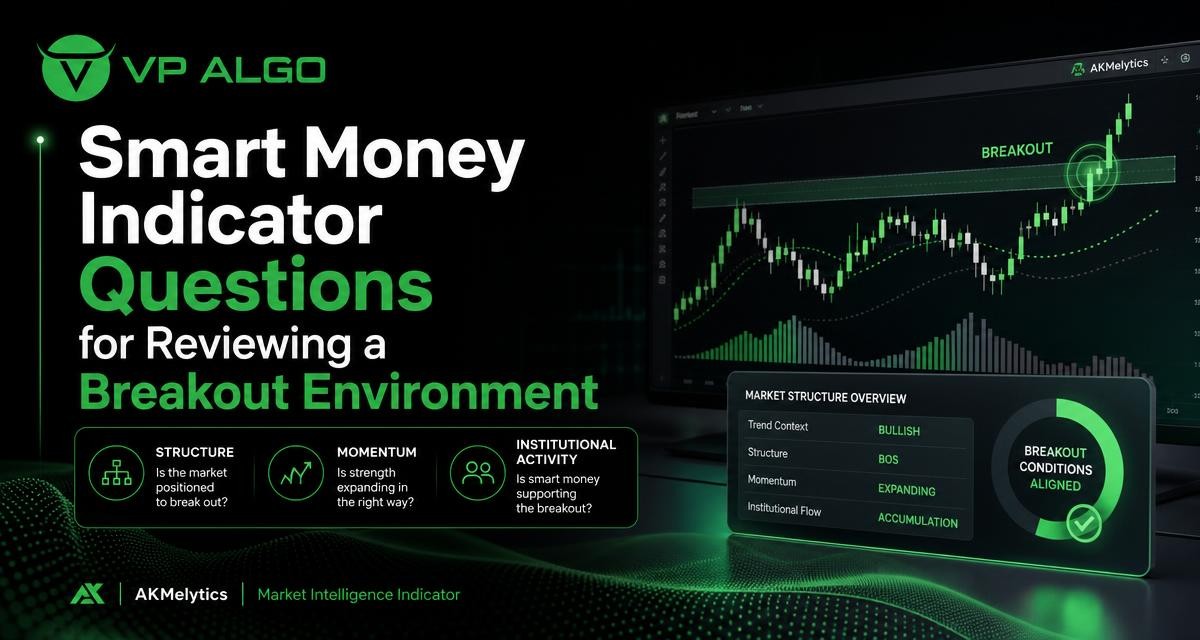
A breakout can look convincing on a chart and still deserve closer review. A smart money indicator can help traders organise that review by bringing market structure, momentum, trend conditions and institutional activity into the same discussion. The goal is not to treat one indicator reading as a prediction, but to ask better questions before interpreting a potential setup.
Why breakout conditions need more than a single signal
A breakout occurs when price moves beyond a level that traders have been watching, such as a prior high, prior low, range boundary or other visible area of structure. The move may suggest a change in participation, but the first move through a level does not automatically explain whether the market is accepting the new price area or briefly testing it.
This is why breakout review benefits from several connected perspectives. Market structure describes where price is moving in relation to previous swing points. Momentum helps assess the strength and persistence of the move. Trend analysis provides broader context, while institutional activity and smart money concepts can add another layer for examining participation and possible areas of interest.
A TradingView indicator such as AKMelytics – Market Intelligence Indicator is designed to support this type of structured market review. Its stated feature set includes trend analysis, momentum evaluation, market structure, institutional flow monitoring, multi-timeframe trend assessment and smart money analysis. Traders should still interpret those features within a defined process rather than using them as a substitute for judgment or risk management.
What questions should be asked before calling a move a breakout?
The word “breakout” can describe very different situations. Price may close beyond a range after prolonged compression, briefly move through a level and return, or continue in the direction of an established trend. Asking consistent questions helps separate the event itself from the interpretation that follows.
- What specific level or structure has price moved beyond?
- Did the move produce a meaningful change in the sequence of highs and lows?
- Is momentum expanding, fading or simply reacting to a short-term movement?
- Does the broader trend agree with the direction of the breakout?
- Is there evidence of increased participation or institutional activity to examine?
- Has price held beyond the level, or has it quickly returned inside the prior range?
- What would invalidate the interpretation?
These questions do not produce a guaranteed outcome. They create a repeatable checklist that can make chart analysis more deliberate and less dependent on the excitement of a fast price move.
Question one: What structure has actually been broken?
The first task is to define the level precisely. A breakout above a recent swing high is not necessarily the same as a breakout above a major range boundary. Similarly, a move below a nearby low may have limited significance if the wider market is still trading within a larger structure.
Review the sequence of highs and lows
A market structure indicator can help traders examine whether price is forming higher highs and higher lows, lower highs and lower lows, or a less directional sequence. This matters because a price movement through one level can have different implications depending on the surrounding structure.
For example, an upside move that breaks a recent lower high may be worth reviewing as a possible structural shift. An upside move that occurs after a sequence of higher highs may instead represent continuation. These are not identical situations, even if both appear as bullish breaks on a chart.
Distinguish a level from a zone
Markets do not always respond to a single exact price. A group of highs, lows or repeated reactions may form a zone where buyers and sellers have previously contested price. Reviewing the area around a breakout can be more useful than focusing on one line alone.
A smart money trading indicator may help display structural information, but the trader still needs to understand what the marked area represents. The more clearly the level is defined, the easier it becomes to evaluate whether price has truly moved beyond it or has only created a temporary wick.
Question two: Is momentum supporting the breakout?
Structure tells you what price has done relative to previous points. Momentum asks how forcefully the move is developing. A breakout with strong directional movement may deserve a different review from a breakout that barely clears resistance and immediately slows.
A momentum indicator for TradingView can be used as one part of this assessment. Look for information about whether momentum is increasing, decreasing or moving without a clear directional bias. The exact interpretation depends on the indicator settings and the trader’s method, so the reading should be considered alongside price rather than in isolation.
Questions for momentum review
- Did momentum expand as price approached and crossed the level?
- Is the move continuing after the initial break, or is momentum already weakening?
- Does momentum agree with the direction shown by market structure?
- Is the apparent strength visible only on a short timeframe?
- Could the reading be reacting to a brief price spike rather than sustained participation?
Momentum confirmation is not the same as proof that a move will continue. It simply provides context for judging whether the breakout has active follow-through at the time of review.
Question three: Does the broader trend agree with the breakout?
A breakout is easier to interpret when its direction is compared with the trend on a wider timeframe. A move above a local range may align with a broader upward structure, conflict with a broader downward structure, or occur while the market remains generally sideways. Each context calls for a different level of caution.
Multi-timeframe trend assessment can help prevent a trader from treating a short-term event as the complete market picture. For instance, a lower-timeframe bullish break may be a continuation within a wider uptrend, or it may be a countertrend rally inside a larger decline. The indicator can organise the information, while the trader determines which timeframe relationships matter for the strategy being reviewed.
| Breakout context | Questions to review | What the context does not establish |
|---|---|---|
| Breakout aligned with a wider trend | Is the local structure continuing the broader direction? Is momentum supporting the move? | It does not guarantee continuation or define a suitable entry. |
| Breakout against the wider trend | Is there evidence of a genuine structural change, or only a short-term reaction? | It does not prove that the previous trend has ended. |
| Breakout inside a sideways environment | Has price been accepted outside the range, and is participation changing? | It does not confirm that a new trend has begun. |
| Multi-timeframe disagreement | Which timeframe is relevant to the planned analysis, and what would invalidate the view? | It does not mean one timeframe is automatically correct. |
The purpose of this comparison is not to rank one context as always better. It is to make the surrounding conditions visible before a trader assigns meaning to the breakout.
Question four: What does institutional activity add to the review?
Institutional activity is often discussed in relation to smart money concepts, order flow and areas where larger participants may have influenced price. These ideas can be useful for generating questions about participation, but they should not be presented as direct knowledge of every participant’s intentions.
An institutional flow indicator may help traders monitor information related to activity or flow within the indicator’s design. When a breakout occurs, the relevant question is whether the activity information supports a change in market conditions or whether price has moved without comparable confirmation in the available data.
Useful institutional activity questions
- Does the activity information change near the breakout level?
- Is the observed activity consistent with the direction of the structural move?
- Does the signal appear across the selected timeframe or only briefly?
- Are there signs of interest around the level that could affect a retest?
- What information is missing from the indicator, and what assumptions should be avoided?
The final question is especially important. An indicator can display calculated information and analytical conditions, but it cannot reveal every order, participant or future event. Treating institutional activity as context rather than certainty helps keep the review grounded.

Question five: Is the breakout holding, or is price rejecting the level?
The first move beyond a level is only one part of the case study. The next question is how price behaves after the break. A close beyond the level, a continuation move and a later retest can tell a different story from a quick return into the former range.
Some traders examine whether a former resistance area behaves as support after an upside break, or whether former support acts as resistance after a downside break. This type of review focuses on the relationship between price and structure rather than on a single alert or marker.
A smart money indicator can help keep the relevant conditions visible while the trader observes the market. However, the indicator should not be used to assume that every retest will succeed. A failed hold may be information that changes the original interpretation, not an event to be ignored.
Question six: Are multiple signals saying the same thing?
Combining several features can be helpful when each feature answers a different question. Market structure may describe the location of the break, momentum may describe the force of the move, trend analysis may provide broader context, and institutional activity may offer additional participation-related information.
The purpose is not to collect as many signals as possible. Repeating the same conclusion in several visual forms does not necessarily create independent confirmation. A better approach is to identify what each component contributes and where the evidence disagrees.
| Review area | Primary question | Example of disagreement |
|---|---|---|
| Market structure | Has a meaningful high, low or range boundary changed? | Price breaks a minor high while the wider structure remains bearish. |
| Momentum | Is the movement gaining or losing force? | Price makes a new high while momentum weakens. |
| Trend | Does the broader direction support the local move? | A short-term bullish breakout develops inside a wider sideways market. |
| Institutional activity | Is there additional activity information near the event? | Activity readings do not clearly align with the price movement. |
Disagreement is not automatically a reason to reject an idea, but it is a reason to describe the setup more carefully. It may indicate that the market is transitional, that the chosen timeframe is too narrow, or that the breakout requires more observation.
How to build a breakout review process with a smart money indicator
A repeatable process can reduce impulsive interpretation. The following sequence is designed for chart review and educational analysis, not as a promise of a particular trading result.
- Mark the relevant structure. Identify the range, swing point or zone that price is testing.
- Define the event. Record whether price has crossed, closed beyond or returned through the level.
- Check the wider trend. Compare the local move with the selected higher timeframe context.
- Review momentum. Note whether momentum supports, weakens or does not clearly relate to the move.
- Examine activity information. Consider what institutional flow or smart money features add without treating them as certainty.
- Look for acceptance or rejection. Observe whether price holds beyond the level or returns to the previous structure.
- Write the invalidation condition. State what future price behaviour would challenge the original interpretation.
Writing down the reasoning can be as valuable as viewing the signals. It makes it easier to review whether the analysis relied on structure and context or simply reacted to a visually prominent marker.
Common mistakes when reviewing breakout signals
Assuming every break is a new trend
A break can occur inside a larger range or against a broader trend. Without checking multiple structural levels, traders may give a local move more importance than it deserves.
Using confirmation as a guarantee
When several readings point in one direction, the result may feel conclusive. Yet technical conditions can change, and no indicator eliminates uncertainty or trading losses. Confirmation should improve the quality of the review, not create false confidence.
Ignoring timeframes
A signal on one timeframe may conflict with the structure on another. The answer is not always to choose the most favourable chart. Instead, define which timeframe is being analysed and explain how the other timeframes affect the interpretation.
Adding too many tools without a clear role
More indicators can make a chart harder to read. Each feature should have a specific purpose. If two tools provide the same information, adding both may increase visual complexity without improving the underlying analysis.
Forgetting the invalidation point
A review that only explains why a breakout could continue is incomplete. It should also identify the price behaviour or structural change that would weaken the thesis.
Where AKMelytics fits into this type of analysis
AKMelytics – Market Intelligence Indicator is intended for TradingView users who want a more structured way to review market conditions. The listed capabilities relate to trend analysis, momentum signals, market structure, institutional flow monitoring, multi-timeframe assessment and smart money analysis.
Those capabilities can support a breakout case study by bringing related questions into one workflow. Traders can review where the break occurred, how momentum behaved, whether the wider trend agreed and what activity information was available. The tool remains a decision-support and educational resource rather than a financial adviser or a replacement for a trader’s own process.
VP ALGO TRADING also provides support for installation, activation and usage questions after purchase. The supplied company information states that a request-based seven-day free trial is available for its indicator and Telegram channel. Trial or access details should be confirmed directly with the company, since eligibility and terms can change.
A practical checklist for chart review
Before completing a breakout review, use a short checklist that keeps the analysis focused:
- Have I identified the exact structure or zone being tested?
- What changed in the sequence of highs and lows?
- Does momentum support the move, weaken it or remain unclear?
- What does the broader timeframe show?
- What does the smart money or institutional activity information add?
- Has price held beyond the breakout area?
- What would invalidate my interpretation?
- Am I treating the indicator as analysis assistance rather than financial advice?
This process helps turn a fast-moving chart event into a documented analytical question. It also creates a clearer basis for reviewing decisions later, regardless of whether the breakout continues, fails or remains unresolved.
Frequently asked questions
What is a smart money indicator?
A smart money indicator is a charting tool that presents information related to market structure, trend, momentum, institutional activity or smart money concepts. Its output should be interpreted as analytical context, not a guaranteed forecast.
How can a smart money indicator help review a breakout?
It can organise questions about the level being broken, the surrounding structure, momentum, broader trend and activity information. This may make the review more systematic than relying on the breakout candle alone.
What is the role of a market structure indicator?
A market structure indicator helps traders examine relationships between swing highs, swing lows, ranges and possible structural changes. It does not determine whether a trade will succeed.
Does a breakout confirmed by several signals guarantee continuation?
No. Multiple signals may provide context, but market conditions can change and every technical interpretation remains uncertain. Confirmation is not a guarantee of future price behaviour.
Why should traders compare multiple timeframes?
Multiple-timeframe review can show whether a local breakout agrees with, conflicts with or sits inside a wider trend. This prevents a short-term move from being treated as the entire market structure.
Can AKMelytics be used as financial advice?
No. The indicator is intended to assist educational and trading-decision analysis. VP ALGO TRADING does not position its products as official financial advice, and users remain responsible for their own decisions and risk assessment.


Recent Comments