
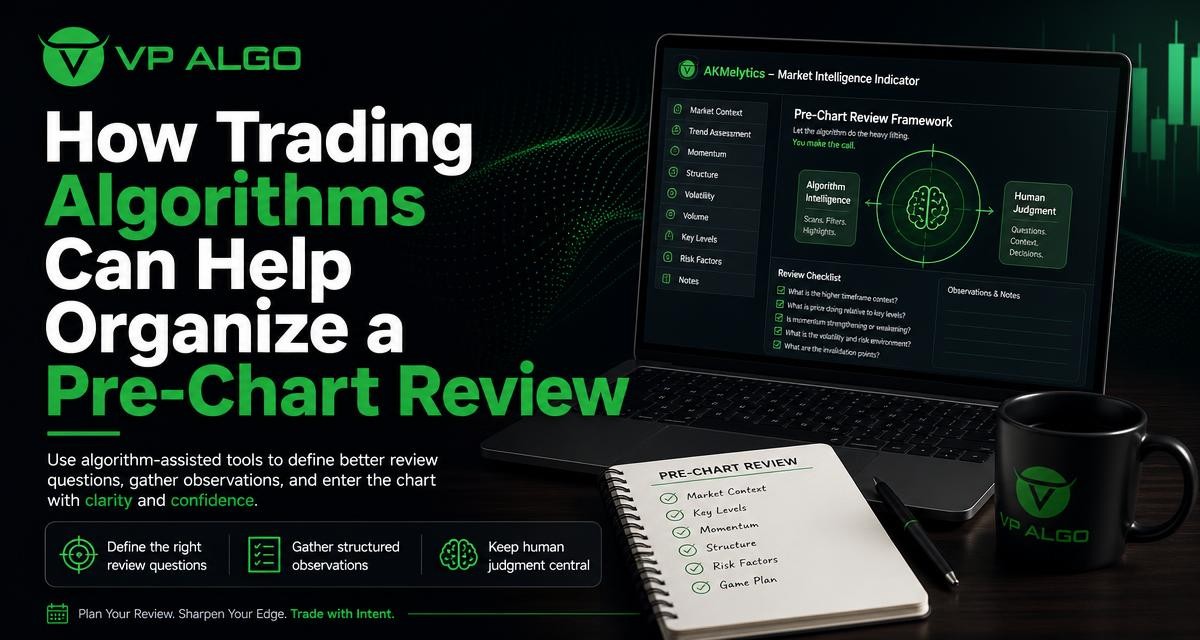
Trading algorithms can help organize a pre-chart review by turning a broad market scan into a repeatable set of questions. Instead of opening a chart and reacting to every visible movement, a trader can first define what to examine, collect relevant observations and then apply human judgment to the complete picture. This approach does not remove uncertainty or make decisions automatic. It provides a clearer starting point for stock technical analysis and other forms of chart-based review.
What is a pre-chart review?
A pre-chart review is the preparation stage before interpreting a specific chart or considering a potential setup. It is where a trader establishes context: what market or instrument is being reviewed, which timeframe matters, what type of movement is present and what questions need answering.
Without this preparation, chart analysis can become reactive. A sudden candle, a familiar pattern or a prominent indicator reading may draw attention before the broader conditions have been considered. A pre-chart review creates a pause between observation and interpretation. That pause can make the process more consistent, especially when a trader reviews several instruments or works across multiple timeframes.
Questions a pre-chart review can define
- Is the broader trend moving upward, downward or sideways?
- Does momentum support the current direction or appear to be weakening?
- What market structure is visible on the selected timeframe?
- Are there signs of a change in structure, continuation or consolidation?
- What observations need confirmation on another timeframe?
- What information is still missing before the chart can be interpreted responsibly?
The goal is not to produce a forced answer to every question. Sometimes the most useful result of a review is recognizing that conditions are mixed or that the available evidence is not clear enough for a confident interpretation.
Where trading algorithms fit into the process
Trading algorithms used in indicators can process market data according to defined rules and present selected observations on a chart. Depending on the tool, those observations may relate to trend, momentum, market structure, institutional activity or smart money concepts. This can help a trader organize information that might otherwise be reviewed manually and inconsistently.
In a pre-chart workflow, an algorithm-assisted indicator is best treated as an observation and organization layer. It can draw attention to areas that deserve review, group related signals and help a trader compare conditions across timeframes. The trader remains responsible for understanding what the displayed information represents, checking the chart itself and deciding how much weight each observation deserves.
| Pre-chart question | Useful algorithm-assisted observation | Human review still required |
|---|---|---|
| What direction is the market showing? | Trend assessment or directional signals | Whether the trend is meaningful for the chosen timeframe and purpose |
| Is movement strengthening? | Momentum readings or changes in momentum | Whether momentum agrees with price action and market context |
| How is price behaving structurally? | Market structure markers or detected levels | Whether the structure is clear, developing or potentially ambiguous |
| Are broader conditions aligned? | Multi-timeframe trend observations | Which timeframe should carry more importance for the review |
| Is there evidence related to smart money concepts? | Smart money or institutional activity observations | Whether the observation has a reasonable interpretation in context |
Start with a review question, not an indicator signal
A useful pre-chart review begins with a question rather than a search for confirmation. For example, a trader may ask whether an instrument is trending or ranging, whether a recent move has changed market structure, or whether momentum is supporting the current direction. The indicator can then help organize observations relevant to that question.
This order matters. If a trader begins with a prominent signal and builds a story around it afterward, the review may become biased toward that signal. Starting with a question encourages a more balanced reading of the chart. The tool becomes a way to inspect evidence rather than a substitute for the reasoning process.
Examples of focused review questions
- Trend question: Is the current price action aligned with the broader directional movement?
- Momentum question: Is momentum confirming the move, fading or conflicting with it?
- Structure question: Has price maintained the existing structure, or is a structural change developing?
- Multi-timeframe question: Do the selected timeframes present a consistent picture?
- Participation question: Are there observations associated with institutional activity or smart money concepts that deserve closer examination?
These questions are deliberately narrower than “Should I trade?” A chart review can identify conditions and uncertainties without producing a trading instruction. Keeping the initial question specific also makes it easier to document what was actually observed.
Organizing trend and momentum observations
Trend analysis and momentum analysis answer related but different questions. Trend analysis concerns direction and structure over a chosen period. Momentum concerns the strength or pace behind movement. A market can show a directional trend while momentum is weakening, or display strong short-term momentum inside a broader sideways environment.
An algorithm-assisted workflow can place these observations next to one another so they are less likely to be treated as the same thing. A trend indicator for TradingView may help identify directional conditions, while momentum-related readings can prompt a closer look at acceleration, deceleration or disagreement between price and the indicator.
A practical sequence for reviewing trend and momentum
- Set the review timeframe. Decide which chart will provide the main context and which, if any, will provide additional perspective.
- Record the broad direction. Describe the market as upward, downward, sideways or unclear rather than forcing a stronger label.
- Check momentum. Ask whether momentum supports the direction, is weakening or is giving a mixed reading.
- Compare price with the indicator. Look for agreement and disagreement rather than focusing only on the most attractive signal.
- Note the limitation. Record what the trend and momentum observations do not establish, such as the timing or quality of a potential setup.
This sequence supports a more disciplined review because each observation has a defined role. It also prevents a momentum reading from being interpreted as proof of a trend, or a trend reading from being treated as evidence that movement will continue.
Using market structure as a separate layer
Market structure gives the review a framework for describing how price has been moving. Traders may examine swings, breaks, consolidations and changes in the relationship between recent highs and lows. An indicator that highlights market structure can make these areas easier to locate, particularly when the chart contains a large amount of visual information.
However, a displayed structure marker is still an observation to inspect. The trader should consider the timeframe, the amount of price history visible and whether the apparent break has meaningful follow-through. A small movement may look significant on one chart while appearing minor in a wider context.
Structure observations worth documenting
- The most recent sequence of relevant highs and lows.
- Whether price is continuing an established structure or moving within a range.
- Any apparent break of structure and the price action that followed it.
- Areas where structure appears unclear because of overlapping or volatile movement.
- Whether the structure on a lower timeframe agrees with the broader chart context.
Documenting uncertainty is especially useful. If a structure reading is ambiguous, that fact should remain part of the review instead of being removed to create a cleaner narrative.
Adding multi-timeframe context without creating confusion
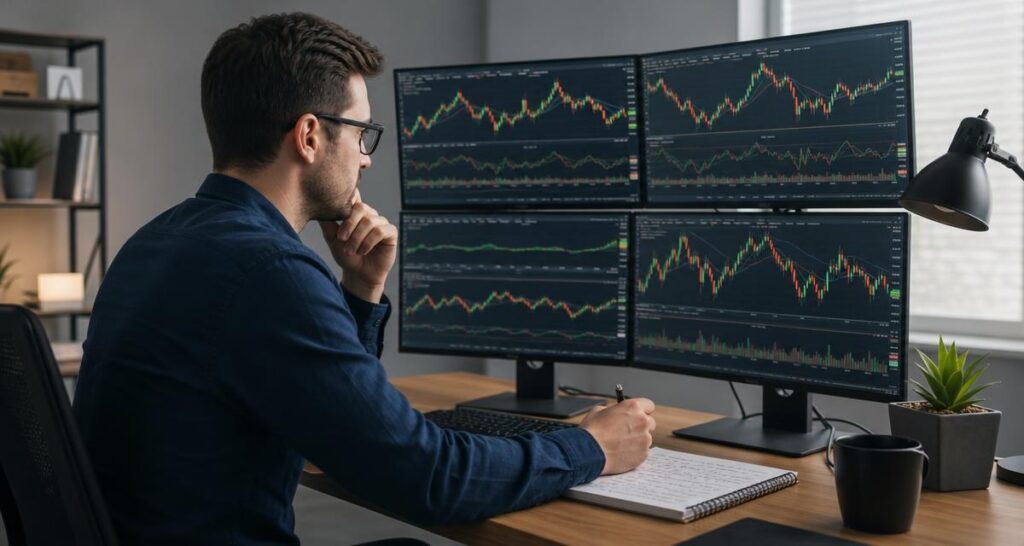
Reviewing more than one timeframe can add context, but it can also produce conflicting observations. A higher timeframe may show a broad directional movement while a lower timeframe shows a counter-move or consolidation. These readings do not necessarily invalidate one another; they describe different layers of the market.
Trading algorithms and TradingView indicators can help arrange multi-timeframe information, but the trader must decide how to use it. Before reviewing the chart, define the role of each timeframe. One may provide broad context, another may show the current structure and another may be used only to examine detail. Without these roles, a trader may keep switching timeframes until finding the reading that best supports an existing opinion.
| Timeframe role | Primary question | Common review mistake |
|---|---|---|
| Broad context | What general environment is visible? | Using a short-term movement to redefine the broader picture |
| Working timeframe | What structure and momentum are most relevant to the review? | Ignoring conflicting information from the broader context |
| Detailed view | What recent price action needs closer inspection? | Treating small fluctuations as decisive evidence |
Considering smart money and institutional activity observations
Some indicator-based tools include observations connected with smart money concepts or institutional activity. These features can give traders another category of information to review alongside trend, momentum and structure. They may help focus attention on areas that appear relevant to participation, flow or changes in market behavior.
Such observations should be interpreted carefully. A label or visual marker does not independently explain why price moved, identify every participant involved or establish what will happen next. The useful role in a pre-chart review is to prompt questions: Does the observation align with the visible structure? Is it occurring in a meaningful location on the chart? Does it conflict with the broader trend or simply describe a different timeframe?
Keeping this category separate from price direction can improve clarity. A trader can record what the tool highlights, then compare it with direct chart observations rather than allowing a smart money label to determine the entire interpretation.
How AKMelytics can support a structured review
VP ALGO TRADING offers the AKMelytics – Market Intelligence Indicator as a TradingView-focused tool for organizing market observations. The business describes its indicator tools in relation to areas such as trend analysis, momentum evaluation, market structure, institutional activity, multi-timeframe trend assessment and smart money analysis.
For a pre-chart review, this type of tool can serve as a central reference point. A trader may use its displayed observations to create a checklist, compare conditions across selected timeframes and identify questions for closer chart inspection. It should not be treated as a replacement for reading price action or exercising judgment. Its value depends on whether the trader understands the information shown and uses it as part of a defined process.
A sample AKMelytics review workflow
- Define the scope. Choose the instrument, review timeframe and purpose of the analysis.
- Read the broad trend. Record the directional or range conditions shown by the chart and indicator.
- Review momentum. Note whether momentum supports, weakens or conflicts with the observed direction.
- Inspect structure. Examine recent highs, lows, possible breaks and areas of consolidation.
- Check broader timeframes. Compare the working chart with the timeframes assigned to provide context.
- Review smart money observations. Treat them as prompts for further inspection, not as standalone conclusions.
- Write the unresolved questions. Identify what remains unclear before forming an interpretation.
- Apply human judgment. Decide whether the evidence is coherent, mixed or insufficient for the intended review.
What trading algorithms cannot decide for you
Algorithm-assisted indicators can organize information, but they do not remove the need for interpretation. They cannot determine whether a particular observation is important to a trader’s own objectives, how much uncertainty is acceptable or whether a chart deserves further study. They also cannot make a displayed signal meaningful when the trader does not understand its basis or limitations.
A tool does not guarantee profitable results, eliminate losses or turn an uncertain market into a predictable one. It is more accurate to view trading algorithms as structured aids. They can help reduce disorganized scanning and make recurring observations easier to record, while the trader remains responsible for reviewing the chart and making decisions within an appropriate risk framework.
Common mistakes to avoid
- Signal-first analysis: Searching for reasons to support a marker before defining the review question.
- Overloaded charts: Adding more signals until the original price action is difficult to read.
- Timeframe switching: Moving between charts without assigning each timeframe a clear purpose.
- False precision: Treating an algorithmic label as an exact prediction rather than an observation based on rules.
- Ignoring disagreement: Discarding conflicting trend, momentum or structure information because it complicates the conclusion.
- Skipping notes: Relying on memory instead of recording what was visible before the interpretation was formed.
Building a repeatable pre-chart checklist
A checklist should be short enough to use consistently but detailed enough to prevent important context from being missed. The exact questions can vary by trading style, but the following structure provides a practical starting point.
| Review stage | Record |
|---|---|
| Scope | Instrument, date of review, main timeframe and purpose |
| Trend | Upward, downward, sideways or unclear conditions |
| Momentum | Supporting, weakening, conflicting or unavailable |
| Structure | Recent swings, consolidation and possible structural changes |
| Multi-timeframe context | How broader and more detailed views relate to the main chart |
| Smart money observations | Relevant markers and how they compare with visible price behavior |
| Open questions | Information that remains uncertain or requires closer inspection |
Over time, these notes can help a trader evaluate the quality of the review process itself. The purpose is not to collect a large archive of signals or to prove that a method always works. It is to make the reasoning more visible, identify repeated sources of confusion and improve consistency in how charts are approached.
Final perspective
Trading algorithms can make a pre-chart review more organized by grouping observations related to trend, momentum, market structure, multi-timeframe conditions and smart money concepts. Used well, they help traders begin with defined questions instead of reacting to the first noticeable chart feature.
The strongest workflow keeps the roles clear. The algorithm-assisted tool helps surface and arrange information; the chart provides the underlying context; and the trader evaluates the evidence, uncertainty and relevance. For traders using a TradingView indicator such as AKMelytics, that balance can support a more deliberate approach to stock technical analysis without turning an indicator into a promise or a substitute for judgment.
Frequently asked questions
What are trading algorithms used for in a pre-chart review?
They can process market information according to defined rules and organize observations such as trend, momentum, market structure and multi-timeframe conditions. They help structure the review but do not make the final interpretation for the trader.
Can trading algorithms predict what a market will do next?
No tool should be treated as a guarantee of future market behavior. Algorithm-assisted indicators display observations based on their design, while market conditions remain uncertain and require human evaluation.
How does a pre-chart review differ from regular chart analysis?
A pre-chart review happens before detailed interpretation. It defines the questions, timeframes and categories of information to examine, helping the trader approach the chart with a clearer process.
Why review trend and momentum separately?
Trend describes directional conditions, while momentum concerns the strength or pace of movement. They can agree, conflict or change at different times, so separating them can produce a more precise review.
What is the role of market structure in technical analysis?
Market structure helps describe relationships between price swings, consolidations and possible changes in direction. It provides context for interpreting other observations rather than acting as a standalone conclusion.
How should smart money indicator readings be interpreted?
They should be treated as observations that prompt further chart review. Compare them with price structure, trend, momentum and timeframe context instead of treating a label as proof of a future outcome.
Does an indicator replace a trader’s judgment?
No. An indicator can help organize information, but the trader must understand the displayed observations, consider uncertainty and decide how relevant they are to the review.


Recent Comments