
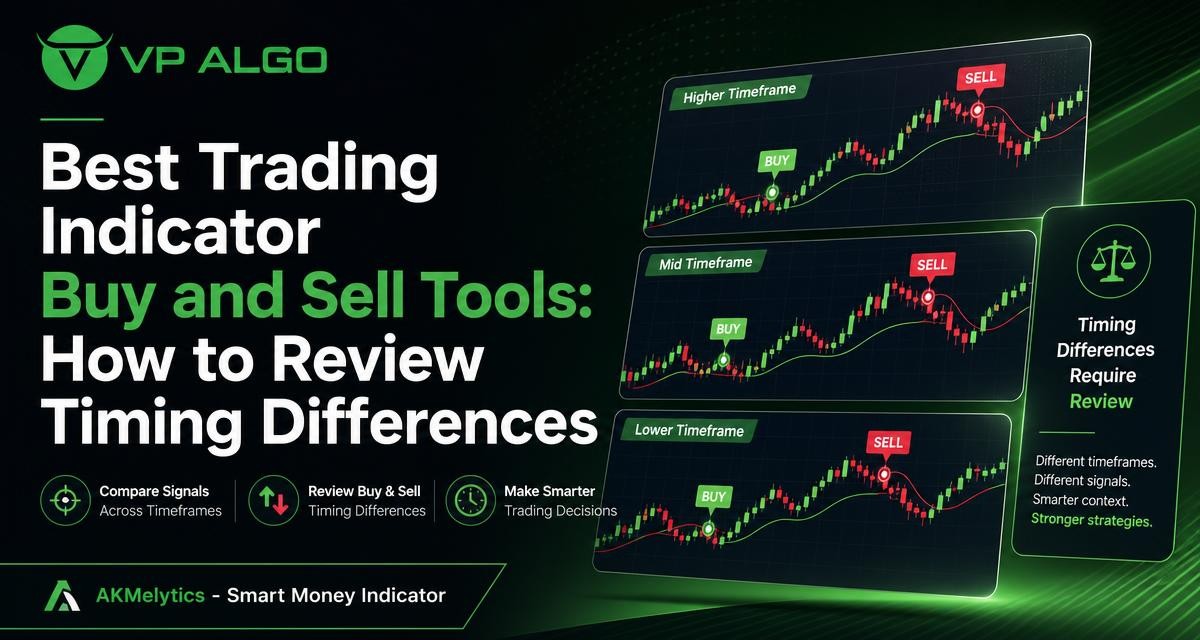
Finding the best trading indicator buy and sell tool is not only about identifying which indicator produces a signal first. A buy indication on one timeframe may appear after a broader trend has already changed, while a sell indication on another may reflect a short-term pullback rather than a complete reversal. Reviewing these timing differences can help traders interpret signals more carefully and build a structured analysis process around trend, momentum, market structure, institutional activity, and smart money concepts.
Why buy-and-sell indications appear at different times
Trading indicators examine price information in different ways. Some focus on momentum, others on trend direction, market structure, volatility, relative strength, or the relationship between price and previous swing points. Because each calculation has a different purpose, two tools can produce different indications even when they are applied to the same chart.
Timeframe is another major reason for the difference. A lower timeframe captures more short-term price movement, so its indications may change quickly. A higher timeframe filters out more of that movement and may show a broader trend. Neither view automatically replaces the other. The useful question is whether the indication makes sense within the timeframe being analysed and whether it agrees with the wider market context.
| Source of timing difference | What may happen | What to review |
|---|---|---|
| Timeframe | A lower timeframe may turn before a higher timeframe. | Check whether the signal is a short-term move or part of a broader trend. |
| Indicator purpose | A momentum tool may react before a trend or structure tool. | Identify what the indicator is designed to measure. |
| Price volatility | Fast price movement may create changing or conflicting indications. | Review volatility and whether the signal remains relevant after the candle closes. |
| Market structure | A signal may appear before or after a break of a previous swing. | Look for events such as a break of structure or change of character. |
| Confirmation rules | One tool may require additional conditions before changing state. | Understand the indicator’s settings and confirmation logic. |
What makes a buy-and-sell indicator useful?
A useful trading indicator should help organise analysis rather than encourage a trader to treat every indication as an instruction. A buy or sell label can draw attention to a potential setup, but it does not explain the complete market environment by itself. The trader still needs to examine the direction of the market, the strength of the move, nearby structure, and the possibility of conflicting evidence.
For that reason, the best trading indicator buy and sell tools are often those that provide context alongside indications. A tool that combines several analytical areas can make it easier to ask consistent questions. It should also make clear which information comes from trend analysis, momentum, market flow, structure, or smart money analysis instead of presenting every signal as identical.
Look beyond the label
Buy and sell labels are easy to notice, but the conditions behind them deserve more attention. Before interpreting an indication, review the timeframe, the current trend, recent swing points, momentum behaviour, and whether price is moving through or away from an important structural area. This approach helps separate a possible continuation from a possible reversal or temporary retracement.
Consider how the tool fits your process
Different traders use indicators for different purposes. One trader may use a trend indicator for TradingView to establish directional context, while another may focus on momentum or market structure before studying a potential entry. A tool should fit the trader’s chart-reading process and chosen trading strategies. Adding more indicators does not automatically improve the analysis if they all repeat the same information or create unnecessary conflict.
How timeframe changes the meaning of an indication
Timeframe analysis is central to understanding timing differences. A lower-timeframe buy indication may show that recent price action has gained strength, but it may still be moving against a higher-timeframe decline. Similarly, a higher-timeframe indication may take longer to appear because it is based on a broader sequence of price movements.
One practical way to review this is to assign each timeframe a role. A broader timeframe can provide directional context, while a lower timeframe can help examine the current movement in greater detail. The exact timeframe combination depends on the trader’s method and should not be assumed to produce a particular outcome. The main purpose is to avoid judging a short-term indication without considering the wider chart.
| Chart view | Typical review question | Potential limitation |
|---|---|---|
| Higher timeframe | What is the broader direction and structure? | Indications may appear later and provide less detail about short-term movement. |
| Intermediate timeframe | Does the current move support or challenge the broader context? | Signals may still change when momentum or structure shifts. |
| Lower timeframe | What is happening in the immediate price action? | More short-term noise and faster changes can create conflicting indications. |
When a lower-timeframe indication disagrees
A disagreement between timeframes is not automatically a mistake. It may indicate that the market is in transition, that a pullback is developing, or that short-term momentum is moving against the broader trend. Instead of choosing the signal that appears most attractive, document the disagreement and determine which timeframe has priority in the trading plan.
This review also helps prevent a common interpretation problem: treating a lower-timeframe indication as proof that the higher-timeframe trend has reversed. A change in short-term momentum may be useful information, but a broader reversal generally requires its own evidence, such as a meaningful change in market structure or sustained movement in the opposite direction.
Review trend, momentum, and market structure separately
Trend, momentum, and market structure are related, but they do not describe exactly the same thing. Trend analysis considers the general direction of price. Momentum looks at the strength or speed of movement. Market structure examines swing relationships and events that may show continuation or change. Separating these ideas makes timing differences easier to understand.
Trend analysis
A trend indication can help establish whether the chart is showing upward, downward, or less clearly directional conditions. If a buy indication appears while the broader trend remains downward, the chart may be showing a countertrend move or an early attempt to change direction. The indication deserves review, but it should not be described as confirmation of a completed reversal without supporting evidence.
Momentum evaluation
Momentum can change before a trend indicator changes. This is one reason momentum indications may appear earlier, but earlier does not necessarily mean more reliable in every situation. A momentum shift may lose strength, remain temporary, or occur inside a larger trend. Review whether the movement is sustained and how it relates to nearby structure.
Market structure
Market structure provides a framework for studying previous highs, lows, breaks, and changes in price behaviour. The AKMelytics – Smart Money Indicator includes market structure features such as BOS and CHoCH events, which can help traders examine possible breaks of structure and changes of character alongside other chart information. These events should be interpreted in context rather than used as standalone guarantees of future direction.
Where smart money analysis fits
Smart money concepts are commonly used to study institutional activity, market flow, liquidity-related behaviour, and structural changes. On a chart, this type of analysis can add another layer to a buy-and-sell review by asking whether the indication is supported by broader flow and structure information.
A smart money indicator for TradingView may be useful to traders who want several contextual features in one analysis environment. VP ALGO TRADING’s AKMelytics – Smart Money Indicator combines elements related to momentum, trend analysis, market structure, market flow, relative strength, and smart money concepts. It also includes multi-timeframe analysis, Fibonacci projections, volatility-based target and risk reference levels, dashboard context, and configurable TradingView alerts.
These features are best treated as analytical references. They can help organise a chart review, but they do not remove the need to understand the settings, inspect price action, or consider the risks of a particular decision. The indicator is designed to support analysis of potential trading setups and decision-making, not to provide financial advice or guarantee results.
A practical framework for comparing signal timing
When comparing the best trading indicator buy and sell tools, use the same review process for each indication. This makes the comparison more meaningful than simply counting how many labels appear or choosing the tool that reacts fastest.
- Record the timeframe. Note where the indication appears and whether it is based on a lower, intermediate, or higher chart view.
- Define the indication type. Identify whether it relates mainly to trend, momentum, market structure, flow, relative strength, or a combination of factors.
- Check the broader direction. Compare the indication with the trend and structure visible on the higher timeframe used in your process.
- Review the recent price sequence. Examine relevant highs, lows, breaks, pullbacks, and changes in momentum.
- Look for agreement and conflict. Record which analytical areas support the indication and which ones do not.
- Wait for the condition your method requires. If your trading strategy calls for a close, structure event, or additional confirmation, apply that rule consistently.
- Document the result. A journal can show whether timing differences are expected features of the method or signs that the tool is being interpreted inconsistently.
Comparing indicator categories without overloading the chart
There is no single category that is automatically the best trading indicator for every trader or chart. A trend indicator may be useful for directional context, while a momentum indicator for TradingView may help examine the strength of a current move. A market structure indicator can focus attention on swing behaviour, and a smart money trading indicator may combine structure with flow and related concepts.
| Indicator category | Useful question | Timing consideration |
|---|---|---|
| Trend indicator | What direction is the market generally displaying? | May react more slowly when the direction is changing. |
| Momentum indicator | Is the current movement gaining or losing strength? | May change before broader trend conditions are confirmed. |
| Market structure indicator | Have relevant swing relationships or structural events changed? | Depends on how structure is defined and which swings are considered significant. |
| Smart money indicator | How do flow, structure, and smart money conditions fit together? | May provide broader context but still requires interpretation across timeframes. |
Using several categories can be helpful when each one has a distinct role. However, adding tools simply because they display more buy or sell indications may make the chart harder to read. A structured combination is generally easier to review than a collection of overlapping signals with no defined priority.
Common mistakes when reading buy-and-sell tools
Choosing the earliest signal automatically
The earliest indication may be responsive, but it may also be more exposed to short-term price movement. A later indication can reflect additional confirmation. Rather than ranking signals only by speed, compare what each one measures and whether the timing suits the trading method.
Treating every indication as a complete trade plan
An indication does not automatically define the market context, risk decision, position size, or exit process. It is one part of analysis. Traders should avoid assuming that a chart label supplies personalised financial guidance or removes the need for independent judgment.
Ignoring changing market conditions
A tool may behave differently when price is trending, consolidating, or moving rapidly. Review the surrounding structure and volatility instead of expecting one signal type to have the same meaning in every condition.
Changing settings until the chart looks perfect
Configurable indicators can be adapted to a trader’s analysis process, but frequent changes can make results difficult to evaluate. Record the settings used, understand what they change, and compare observations consistently rather than adjusting them to fit one historical example.
How to use a TradingView indicator responsibly
A TradingView indicator can make technical information easier to organise, especially when it combines several analytical views in a dashboard or chart display. It should still be used as a decision-support tool. Traders need to understand what the indicator shows, what it does not show, and how the selected timeframe affects the interpretation.
VP ALGO TRADING develops and sells indicators and algorithmic trading tools for TradingView. Customers using the AKMelytics – Smart Money Indicator can contact the company for installation, activation, or usage assistance according to the supplied product process. The company positions its indicators for educational and trading-decision assistance rather than as financial advice.
A well-structured review asks not only whether an indication says buy or sell, but also why it appeared, which timeframe produced it, and whether the wider market context supports the interpretation.
Final checklist for reviewing timing differences
- Which timeframe produced the indication?
- What analytical feature generated or supported it?
- Does the higher-timeframe direction agree with the lower-timeframe movement?
- Has momentum changed, or has market structure changed as well?
- Is the indication part of a continuation, pullback, or possible transition?
- Are multiple tools providing distinct information, or repeating the same signal?
- Have the indicator settings and review rules been applied consistently?
- Does the analysis support a defined trading plan without presenting the tool as a guarantee?
Frequently asked questions
What is the best trading indicator buy and sell tool?
There is no single tool that is best for every trader, timeframe, or market condition. A suitable tool is one that fits the trader’s process and provides understandable context around trend, momentum, market structure, or other relevant factors.
Why do buy and sell indications differ between timeframes?
Each timeframe includes a different amount of price information. Lower timeframes react to short-term movement, while higher timeframes represent broader price behaviour, so their indications can appear at different points.
Should a lower-timeframe buy indication override a higher-timeframe sell indication?
Not automatically. The disagreement may represent a short-term move inside a broader decline, or it may be an early sign of changing conditions. Review the role assigned to each timeframe in the trading plan.
What does a market structure indicator add to buy-and-sell analysis?
It can help traders examine swing relationships, breaks of structure, and possible changes in character. These observations add context but still require interpretation alongside trend, momentum, and price behaviour.
Can a smart money indicator guarantee profitable trades?
No. A smart money indicator can organise information related to structure, flow, and smart money concepts, but it cannot guarantee profits, eliminate losses, or predict future results.
How should traders compare different TradingView indicators?
Compare what each tool measures, how it behaves across timeframes, what settings affect its indications, and how clearly it fits your review process. Avoid comparing tools only by the number or speed of their labels.
What is the role of the AKMelytics – Smart Money Indicator?
AKMelytics – Smart Money Indicator is a TradingView technical analysis tool that combines features related to momentum, trend analysis, market structure, market flow, relative strength, and smart money concepts. It is intended to support analysis and decision-making, not provide financial advice.


Recent Comments