
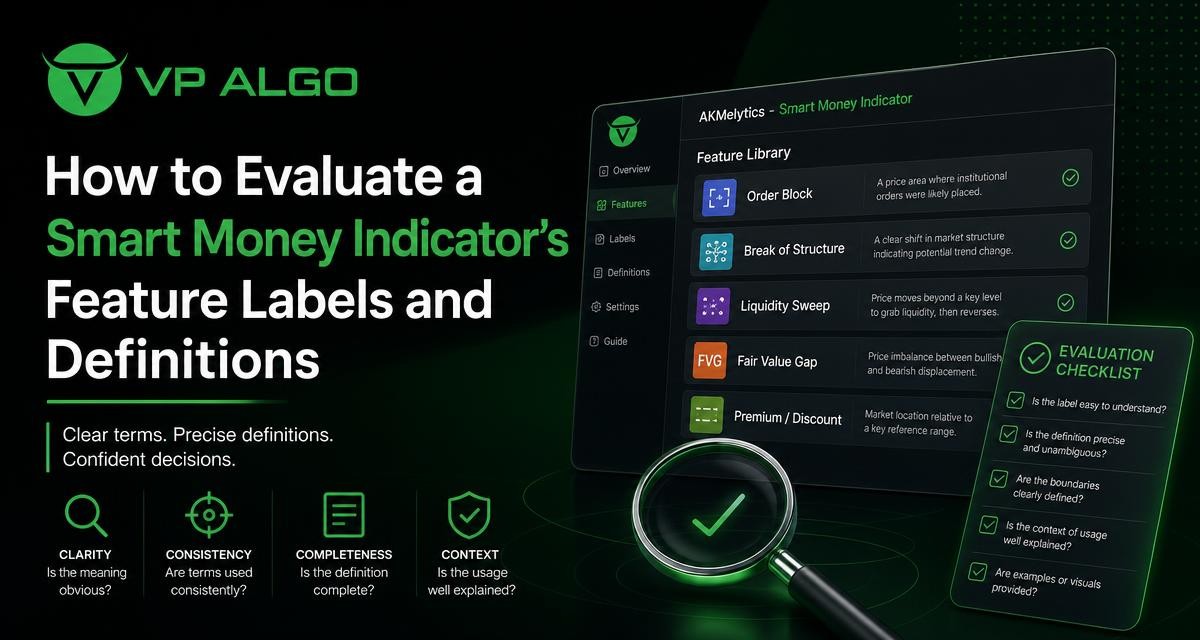
A smart money indicator can display an impressive collection of labels, dashboards, alerts, and market-structure events. However, a crowded chart does not automatically make a tool easy to evaluate. Before relying on any indicator, prospective users should ask whether each feature has a clear definition, a stated purpose, and understandable limitations. This approach helps traders assess what the tool is showing without treating an indicator as financial advice or a guarantee of trading results.
Why feature labels deserve careful evaluation
Terms such as “smart money,” “institutional flow,” “momentum,” “trend,” and “market structure” can mean different things across trading tools. A label may describe a calculated condition, a visual interpretation of price action, or an event generated by a specific algorithm. If the provider does not explain the term, users may assign their own meaning to it and draw conclusions that the indicator was not designed to support.
Clear terminology is especially important when several features appear together. For example, a market structure event may be displayed near a momentum signal, while a higher-timeframe trend assessment points in another direction. A responsible evaluation asks what each signal represents, which inputs it uses, and how the features are intended to be read together.
Start with the basic definition of the smart money indicator
The first question is simple: What does the provider mean by “smart money”? The phrase is widely used in smart money concepts, but it should not be assumed to mean that the tool can directly identify every institutional transaction or predict what professional market participants will do next.
Ask the provider to explain whether the label refers to price structure, market flow, relative strength, volume-related information, algorithmic conditions, or a combination of signals. A useful definition should describe the analytical process in plain language without implying access to private institutional information that has not been stated.
Questions to ask about the main label
- What specific market condition does the term describe?
- Is the label based on price, momentum, trend, market structure, market flow, relative strength, or another input?
- Does the label identify an observed condition, a calculated interpretation, or a possible setup?
- Can the label change after new price data is added?
- Is the term used consistently across all supported chart timeframes?
A clear answer does not need to reveal proprietary source code. It should, however, give users enough context to understand what the label is intended to communicate and what it does not prove.
Separate descriptive labels from predictive claims
One of the most useful distinctions is whether a feature describes what has happened or suggests what might happen. A label showing a change in market structure is different from a label that implies a future direction. Similarly, a momentum reading can describe current strength without establishing that price will continue in the same direction.
When assessing a smart money indicator, look for language such as “potential setup,” “market context,” or “analytical reference” rather than promises of certain outcomes. VP ALGO TRADING positions its TradingView tools for educational and trading-decision assistance purposes, not as financial advice. That distinction should remain clear in the product documentation and in the way chart labels are interpreted.
| Label type | What to clarify | Responsible interpretation |
|---|---|---|
| Trend label | Which timeframe and conditions determine the trend? | A description of assessed direction or context, not a guarantee of continuation. |
| Momentum signal | What measures strength or acceleration? | An indication of current conditions that may change. |
| Structure event | How are events such as BOS or CHoCH defined? | A technical interpretation of price structure requiring context. |
| Flow or smart money label | What does “flow” represent in the calculation? | An analytical reference, not proof of a specific institution’s activity. |
| Target or risk reference | How are levels calculated and what assumptions apply? | A planning reference rather than a promised entry, exit, or result. |
Evaluate market structure terms carefully
Many smart money concepts rely on market structure terminology. Labels such as break of structure, commonly abbreviated as BOS, and change of character, commonly abbreviated as CHoCH, can be useful only when their definitions are consistent. Different tools may use different swing-point rules, confirmation requirements, or lookback settings.
Questions about BOS and CHoCH labels
- What qualifies as a swing high or swing low?
- Does a candle need to close beyond a level, or is an intrabar move sufficient?
- How much price movement is required before a structure event is displayed?
- Are minor and major structure events treated differently?
- Can a structure label be revised as later candles form?
- Does the same definition apply on every timeframe?
These questions help users distinguish between a clearly defined market structure indicator and a chart decoration that appears precise but is difficult to interpret. A provider does not necessarily need to expose every technical parameter, but the important rules should be documented well enough for users to understand why an event appeared.
Check how trend and momentum features interact
A smart money indicator may combine trend analysis and momentum evaluation with market structure. This can give traders several perspectives on a chart, but it can also create confusion when the features disagree. A higher-timeframe trend may be positive while short-term momentum weakens. A structure break may occur while a broader trend assessment remains unchanged.
Ask whether the dashboard presents these readings separately or combines them into one conclusion. Separate readings can make it easier to understand the evidence behind a potential setup. If the tool produces a combined status, users should ask which feature has priority and whether the weighting or decision rule is explained.
Useful questions for trend and momentum labels
- What is the lookback or calculation context for the trend assessment?
- Which timeframe controls a multi-timeframe trend reading?
- Does momentum measure direction, speed, strength, or a combination?
- Can trend and momentum disagree, and how should that disagreement be read?
- Are labels displayed only after confirmation, or can they appear during an unfinished candle?
Clear documentation should also explain whether a label is intended for market context, setup screening, or another purpose. Without that distinction, users may mistake a momentum condition for a complete trading decision.
Ask what “institutional flow” actually represents
Institutional flow is a particularly important label to examine because it can sound more precise than the underlying data allows. A chart tool may use algorithmic calculations, price behavior, relative strength, market flow, or other technical inputs to create a flow-related reading. That does not necessarily mean it directly observes the orders or intentions of a named institution.
For an institutional flow indicator, ask whether the provider explains the data source and the limits of the interpretation. The key issue is not whether the label sounds sophisticated. It is whether a user can understand the relationship between the available market data and the conclusion displayed on the chart.
Questions for flow-related features
- What data is used to produce the flow reading?
- Does the feature represent buying or selling pressure, relative strength, price behavior, or another calculation?
- Is the reading intended to identify confirmed activity or a possible condition?
- Can the label appear when the market is moving quickly or when data is incomplete?
- What should users avoid assuming from the term “institutional”?
Good documentation should avoid presenting an inferred technical reading as direct access to private institutional decisions. This is one of the most important checks when comparing smart money trading indicators.
Review multi-timeframe features and their timing
Multi-timeframe analysis can help users place a lower-timeframe chart within broader trend context. It also creates timing questions. A reading calculated from a higher timeframe may not update at the same frequency as the chart being viewed. Users should understand whether the displayed status reflects a completed higher-timeframe candle, an active candle, or another calculation method.
Ask which timeframes are available, how they are selected, and whether a higher-timeframe reading is used as context or as a condition for another signal. A useful interface should make the selected timeframe visible rather than leaving users to guess why a dashboard label differs from the current chart.
Examine Fibonacci, target, and risk reference labels
Some TradingView indicators include Fibonacci projections and volatility-based target or risk reference levels. These features can support chart analysis, but their definitions matter. Users should know which swing points or market conditions are used to create a projection and whether the levels are automatically adjusted as the chart develops.
Terms such as “target” and “risk” can also be misunderstood. A target reference is not a promise that price will reach a level, and a risk reference is not a substitute for a trader’s own position-sizing process or risk assessment. Ask whether the level is based on volatility, structure, a projected range, or another method, and whether the calculation changes when market conditions change.
Questions about reference levels
- What inputs determine the projected level?
- When does the level become visible?
- Can it move or be recalculated as new candles form?
- Does the label represent a possible planning reference rather than a required action?
- Are the assumptions and limitations explained near the feature description?
Assess alerts as notifications, not decisions
Configurable TradingView alerts can make it easier to monitor a chart without watching it continuously. Before using them, determine exactly what event triggers the alert. An alert might be linked to a structure event, a trend condition, a momentum state, a dashboard status, or another configurable rule.
Users should also check whether the alert is triggered once, repeatedly, or only after a candle closes. The wording matters: an alert should notify the user that a defined condition occurred. It should not be treated as an instruction to enter or exit a trade, particularly when the surrounding market context has not been reviewed.
Look for transparency about changing signals
A responsible evaluation includes a question about whether labels can change. Some chart conditions are calculated during an unfinished candle and may look different by the time that candle closes. Other features may use swing points that become clearer only after subsequent price action. The relevant issue is not simply whether a label changes, but whether the provider explains when and why it can happen.
Ask whether the product documentation distinguishes confirmed events from developing conditions. If a feature can update, users should know how to interpret historical chart examples and live-chart behavior. Clear explanations help prevent a user from assuming that every past label was fixed in exactly the same form when it first appeared.
Use a structured review before choosing a tool
Prospective users can make their evaluation more consistent by reviewing each feature against the same questions. This is particularly useful when comparing several TradingView indicators that use similar terminology but different calculations.
- List every major label. Include dashboard readings, chart markers, structure events, projections, and alerts.
- Find the definition. Check whether the provider explains the term in plain language.
- Identify the input. Note whether the feature is based on trend, momentum, structure, flow, relative strength, volatility, or another condition.
- Check the timeframe. Record whether the label applies to the current chart, a higher timeframe, or multiple timeframes.
- Ask when it becomes valid. Determine whether it appears during an unfinished candle or after a stated confirmation.
- Review limitations. Look for clear statements about changing conditions and the difference between analysis and financial advice.
- Test comprehension. Explain the label in your own words before using it in a chart-review process.
For the AKMelytics Smart Money Indicator, the stated feature set includes momentum, trend analysis, market structure, market flow, relative strength, smart money concepts, multi-timeframe analysis, BOS and CHoCH events, Fibonacci projections, volatility-based target and risk reference levels, dashboard context, and configurable TradingView alerts. Prospective users should use the product documentation and support process to clarify how each listed feature is defined and how the features are intended to work together.
What clear documentation should look like
Clear documentation is practical rather than merely promotional. It should tell users what a feature means, what inputs or conditions influence it, when it updates, and what conclusions should not be drawn from it. Examples can be helpful when they explain the label without implying that the same outcome will occur in future market conditions.
It is also reasonable to ask for installation, activation, or usage assistance when the chart display is difficult to interpret. VP ALGO TRADING states that customers can contact support for these matters and that access is provided through TradingView after the customer supplies the requested TradingView ID. These operational details help a prospective user understand how to begin evaluating the tool, but they do not replace independent judgment about suitability.
Responsible evaluation matters more than impressive terminology
The best smart money indicator for a particular user is not necessarily the one with the most labels. It is the one whose terminology can be understood, whose features have a defined purpose, and whose limitations are visible. A tool that combines trend, momentum, market structure, flow, relative strength, and smart money concepts may provide useful analytical context, but users still need to decide how those readings fit into their own process.
Before treating any label as meaningful, ask what it measures, when it appears, how it can change, and what it does not prove. This disciplined approach supports better chart review and reduces the risk of confusing a technical indicator with a guaranteed trading outcome. Indicators are analytical tools, not substitutes for risk assessment or financial advice.
Frequently asked questions
What is a smart money indicator?
A smart money indicator is a TradingView analysis tool that uses defined technical conditions to present information associated with smart money concepts, market structure, trend, momentum, flow, or related readings. The exact meaning depends on the provider’s definitions.
Does a smart money indicator directly track institutional orders?
Not necessarily. A flow or smart money label may be an interpretation based on available market data and algorithmic calculations. Users should ask what data produces the reading rather than assuming it provides direct access to private institutional activity.
What should BOS and CHoCH mean on an indicator?
BOS generally refers to a break of structure and CHoCH to a change of character, but the precise rules vary. Ask how swing points, confirmation, candle closes, and timeframes are defined by the specific indicator.
Why do multi-timeframe readings need extra clarification?
A higher-timeframe reading may update at a different pace from the chart being viewed. Users should know which timeframe is being assessed and whether the displayed condition comes from a completed or developing candle.
Are target and risk reference levels guaranteed outcomes?
No. They are analytical references based on the indicator’s stated calculation method. They should not be treated as promises that price will reach a level or as a replacement for personal risk assessment.
How should TradingView alerts be interpreted?
An alert should be understood as a notification that a defined condition occurred. It is not automatically a trading instruction, and the surrounding market context should be reviewed before any decision is made.
What is the most important question to ask before using an indicator?
Ask whether you can explain each major label in plain language, including what it measures, when it updates, and what it does not prove. If the answer is unclear, seek documentation or support before relying on the feature.


Recent Comments