
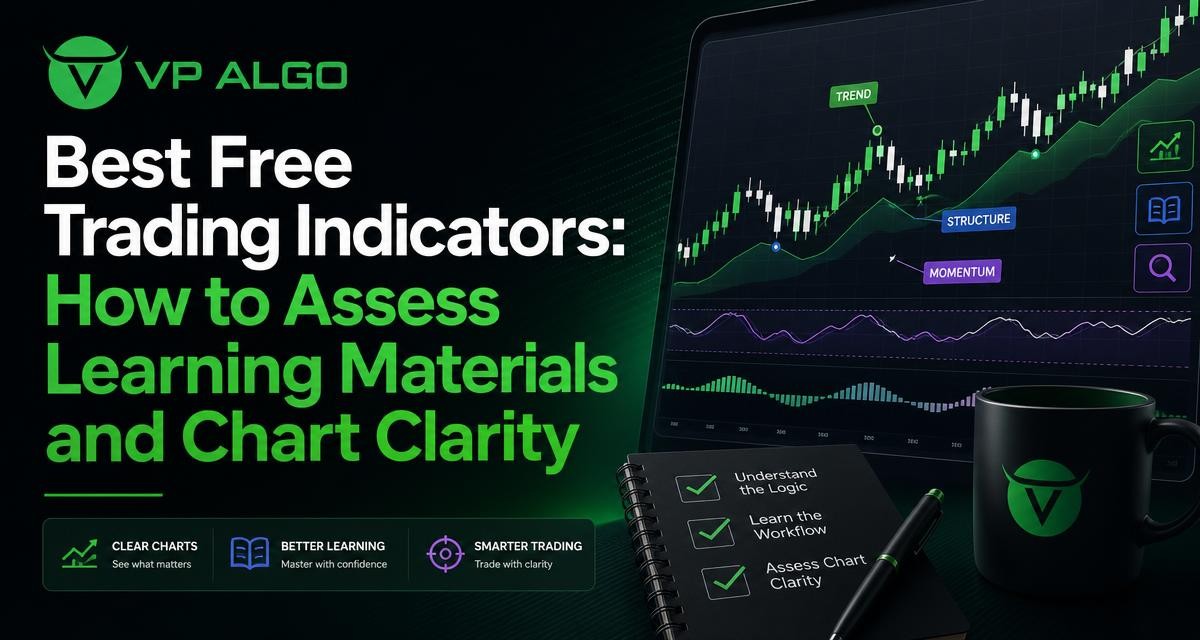
Searching for the best trading indicators free can lead to long lists of familiar tools, but a list alone does not show whether an indicator will help you understand a chart. A better approach is to compare free indicators and learning materials by how clearly they explain market conditions, how easily you can follow the workflow, and whether the information supports disciplined analysis rather than impulsive decisions.
What “best” should mean when comparing free trading indicators
There is no single trading indicator that is best for every trader, chart, or decision process. An indicator may be useful because it measures momentum, highlights a trend, identifies market structure, or organizes several types of information. Its value depends on whether you understand what it is showing and how that information fits into your own analysis.
Free tools can be excellent for learning the basics. They can also become confusing when a chart contains too many signals, unclear labels, or settings that the user cannot explain. Instead of judging an indicator by the number of features it lists, assess whether it helps answer a specific question.
- Direction: Is the market showing a clear trend or moving sideways?
- Momentum: Is price movement gaining or losing strength?
- Structure: Where have meaningful highs, lows, breaks, or changes in character appeared?
- Context: Does the information still make sense when viewed across more than one timeframe?
- Workflow: Can you repeat the same analysis without relying on guesswork?
Start with the learning material, not the signal count
Educational material is often the difference between using a trading indicator thoughtfully and treating it as an automatic answer. A useful guide should explain the purpose of the tool, define its labels, describe relevant settings, and show how the information fits into a broader chart-reading process.
Look for explanations that use plain language and acknowledge uncertainty. A responsible learning resource should not present signals as guaranteed outcomes or imply that an indicator can remove trading risk. It should help you form a testable process: observe the market, identify context, review the indicator, define what would invalidate the idea, and record what happened.
Questions to ask about any free guide
- Does it explain what the indicator measures or detects?
- Are the labels and colours defined clearly?
- Does it distinguish between a signal and a confirmation?
- Does it explain how settings can change the chart?
- Does it show how to avoid using several tools that measure almost the same thing?
- Does it encourage review and practice rather than blind copying?
A guide that answers these questions is more useful than one that simply lists a “best” indicator. The aim is to learn a workflow that you can inspect and improve.
Compare indicators by the job they perform
Different indicator categories support different parts of technical analysis. A momentum indicator may help you study the strength of a move, while a trend indicator may help you organize directional context. A market structure indicator can make events such as breaks of structure easier to examine. These tools should not automatically be treated as interchangeable.
| Indicator role | What it can help you examine | Clarity check |
|---|---|---|
| Trend analysis | Directional context and changes in the prevailing move | Can you tell when the tool is trending, neutral, or lagging? |
| Momentum | The strength or pace of price movement | Are readings explained without presenting them as certain outcomes? |
| Market structure | Highs, lows, breaks of structure, and changes in character | Are the events defined and visible without excessive chart clutter? |
| Flow or activity context | Information intended to help assess participation or market flow | Does the material explain what the feature can and cannot establish? |
| Multi-timeframe analysis | How conditions on one timeframe relate to another | Is the relationship between timeframes explained clearly? |
| Alerts | Notifications when configured conditions occur | Can you identify the condition that triggered the alert? |
This comparison does not mean that every trader needs one tool from every category. Adding more indicators can create overlapping signals and make a chart harder to interpret. The better question is whether each feature adds information that you can understand and use.
Why chart clarity matters
Chart clarity is not just an aesthetic preference. When labels overlap candles, several colours compete for attention, or every movement produces a new marker, it becomes harder to distinguish important context from background noise. A clean chart makes it easier to explain why a setup is being considered and what evidence would challenge that view.
Signs of a clear chart
- The most important information is visually distinct from supporting information.
- Labels use consistent language and placement.
- Settings allow unnecessary elements to be hidden or adjusted.
- Signals do not obscure the price action they are meant to explain.
- The chart remains understandable when you zoom out or change timeframe.
Try reading the chart without immediately acting on a signal. First describe the trend, recent structure, momentum context, and areas that deserve attention. Then examine what the indicator adds. If the tool makes your explanation more precise, it may be helping. If it replaces the explanation with a collection of unexplained prompts, more study is needed.
Understand the workflow before judging the tool
A trading indicator is most useful when it fits into a repeatable process. For example, you might begin with a higher-timeframe view, inspect directional context, review market structure, examine momentum, and then consider whether the chart contains a setup worth researching. The exact order can vary, but the reasoning should be clear.
Tools that combine several analytical areas can reduce the need to switch between separate chart studies. However, combining features does not make a decision automatic. It may simply place trend, momentum, structure, market flow, relative strength, or smart money concepts in one workspace. You still need to understand each component and decide how much weight to give it.
A practical review sequence
- Define the question. Decide whether you are studying direction, momentum, structure, or a possible setup.
- Read price first. Review the visible movement and recent highs and lows before relying on overlays.
- Check context. Consider whether another timeframe changes the interpretation.
- Review the indicator. Identify which labels or readings support, challenge, or add detail to your observation.
- Write down the conditions. Record what would make the idea invalid rather than focusing only on a possible entry.
- Review later. Compare the original reasoning with what the chart eventually showed.
This process turns a free indicator from a signal generator into a study aid. It also makes it easier to compare tools fairly because you are evaluating the same workflow rather than reacting to whichever chart looks most impressive.
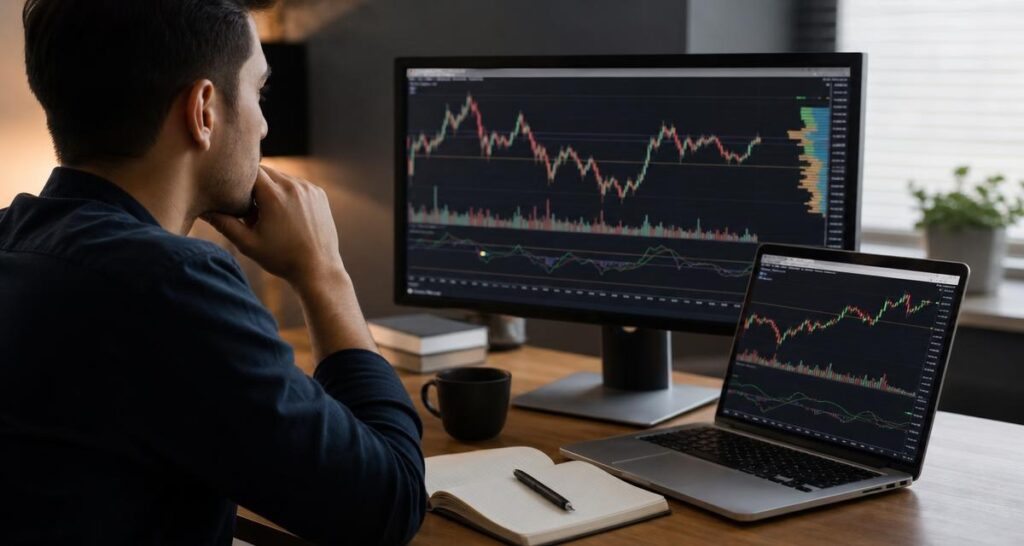
Free indicators versus a combined TradingView tool
Free indicators are useful when you want to learn one concept at a time. A simple momentum study, trend tool, or structure reference can help you see how a particular type of analysis behaves. The main advantages are accessibility and focused practice, although you may need to assemble the workflow yourself.
A combined TradingView tool takes a different approach. The AKMelytics – Smart Money Indicator from VP ALGO TRADING is described as bringing together momentum, trend analysis, market structure, market flow, relative strength, and smart money concepts. It also includes multi-timeframe analysis, BOS and CHoCH structure events, Fibonacci projections, volatility-based target and risk reference levels, dashboard context, and configurable TradingView alerts.
| Evaluation area | Separate free indicators | Combined indicator such as AKMelytics |
|---|---|---|
| Learning approach | Useful for studying one concept at a time | Useful for reviewing several related concepts in one workspace |
| Chart setup | May require several tools and manual organization | Can centralize multiple analytical features |
| Interpretation | Often simpler when each tool has one clear role | Requires understanding how the included features relate |
| Customisation | Varies by the individual indicator | Includes configurable elements, but settings still need review |
| Best use | Concept practice and building fundamentals | Structured analysis when the user understands the workflow |
This is not a claim that a combined tool is automatically better. The right choice depends on your experience, the concepts you are trying to learn, and how much information you can interpret without clutter. Someone learning market structure may prefer a focused tool first, while another trader may value a dashboard that organizes several forms of context.
How to assess smart money and market structure features
Terms such as smart money, institutional activity, BOS, and CHoCH can attract attention, but labels alone do not explain an analysis. Before relying on a smart money indicator, learn what each event means within the tool, when it is marked, and whether it reflects a confirmed change or an evolving condition.
Market structure features should be examined alongside the actual price movement. Ask whether the marked swing points are consistent with the method being taught and whether changing the timeframe changes the interpretation. Also consider whether a structure event is being used as context, confirmation, or a standalone trigger. Those are different roles.
Similarly, references to institutional flow or smart money concepts should not be treated as proof of a future move. They are analytical frameworks intended to help organize observations. A clear product explanation should show the role of the feature without promising a particular market result.
Review alerts, targets, and risk references carefully
Alerts can make a TradingView indicator easier to monitor, but an alert only tells you that a configured condition occurred. It does not decide whether the context is suitable for your plan. Before using an alert, identify the event behind it and check whether the alert can repeat or appear in situations you would not consider meaningful.
Some tools also display Fibonacci projections or volatility-based target and risk reference levels. These can provide a structured way to study possible chart areas, but they are references rather than guarantees. Review how the levels are calculated or presented, and avoid treating a displayed target as an expected result.
- Know which condition creates the alert.
- Check whether the event is based on a completed candle or changing price information.
- Understand whether a reference level is fixed, dynamic, or dependent on settings.
- Record how the feature behaved across different chart conditions.
A checklist for comparing the best trading indicators free
Use the following checklist when reviewing a free indicator, tutorial, or a more advanced TradingView tool:
- Purpose: What specific analytical question does it address?
- Definitions: Are its terms, labels, and visual elements explained?
- Transparency: Can you describe the workflow without guessing?
- Chart clarity: Does it make important information easier to see?
- Context: Can you use it with a broader market and timeframe review?
- Discipline: Does it support a written process rather than emotional reactions?
- Testing: Can you review examples and record observations before making decisions?
- Limitations: Does the material avoid guarantees and explain that analysis remains uncertain?
Score each item using a simple personal scale, such as clear, partly clear, or unclear. The purpose is not to create a universal ranking. It is to identify whether a tool suits your current learning stage and whether you can use it consistently.
Using VP ALGO TRADING’s indicator as a learning reference
VP ALGO TRADING develops TradingView indicators and algorithmic trading tools for traders who want structured market analysis. Its AKMelytics – Smart Money Indicator is positioned as a tool for evaluating potential trading setups and supporting decision-making, not as financial advice or a guarantee of results.
If you are considering it after studying free indicators, begin by reviewing how its trend, momentum, structure, flow, relative strength, and smart money features fit together. The company states that a request-based 7-day free trial is available for its indicator and Telegram channel. Product access after purchase involves providing a TradingView ID by email, while support is available for installation, activation, or usage assistance. Review the current product information and terms directly before making a decision.
Whether you use free studies or a combined tool, keep the same standard: understand the chart, understand the indicator, and separate analysis from certainty. The most useful tool is the one that helps you explain your process clearly and review it honestly.
Frequently asked questions
What are the best trading indicators free for beginners?
The best starting point is usually a simple indicator that teaches one concept clearly, such as trend, momentum, or market structure. Choose based on how well you understand its purpose rather than how many signals it displays.
Can a free trading indicator guarantee profitable results?
No. An indicator can organize market information, but it cannot guarantee profits or eliminate losses. Market conditions change, and every trading decision involves uncertainty and risk.
How many indicators should I use on a TradingView chart?
There is no universal number. Use only the tools you can explain and that add distinct information. Several indicators measuring similar conditions can create clutter and conflicting signals.
What is the difference between a trend indicator and a market structure indicator?
A trend indicator generally helps organize directional movement, while a market structure indicator focuses on price swings and events such as breaks of structure or changes in character. They can provide different types of context.
Are smart money indicators suitable for learning?
They can be useful when their terms and rules are clearly explained. Study what each smart money or structure feature represents, then compare it with the price action instead of treating the label as a guaranteed forecast.
What should I check before using TradingView alerts?
Identify the exact condition that triggers the alert, determine whether it depends on a completed candle or changing price information, and decide how the alert fits into your wider analysis process.
Is AKMelytics a replacement for learning technical analysis?
No. AKMelytics is designed to support analysis and decision-making. Users should still learn the underlying concepts, understand the displayed features, and make their own informed assessments rather than relying on the indicator alone.


Recent Comments