
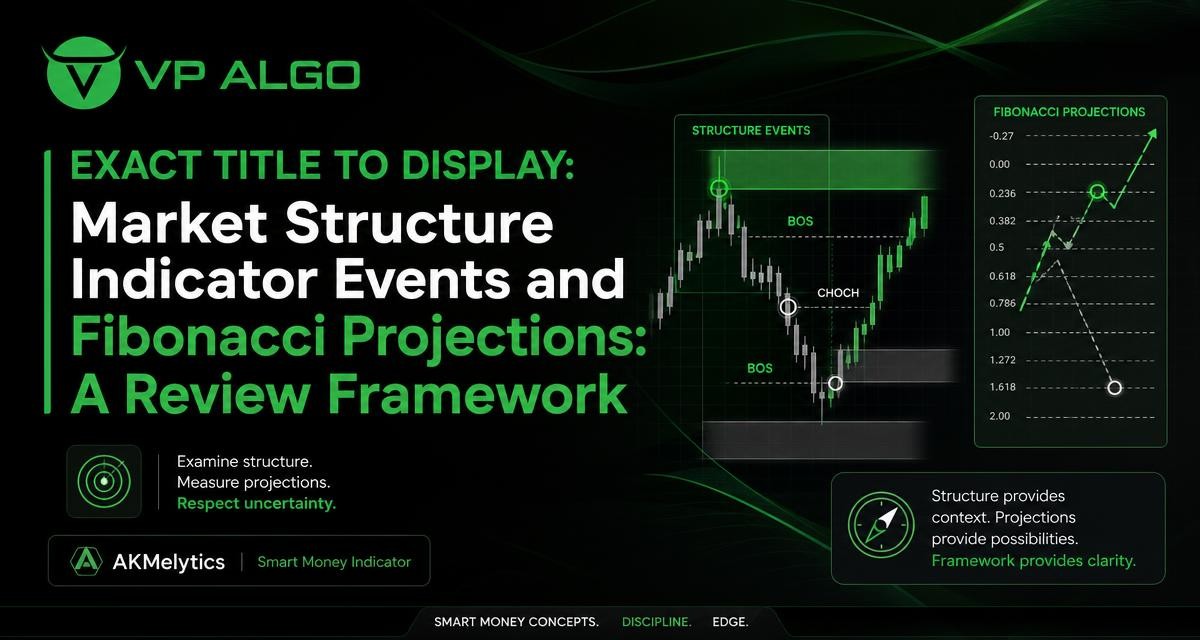
A market structure indicator can help traders organise information about trend direction, momentum and potential changes in price behaviour. When structural events such as Break of Structure (BOS) and Change of Character (CHoCH) are reviewed alongside Fibonacci projections, the result is a more structured analytical process. It is still an interpretation framework, not a promise of what the market will do next.
Why review structure events and projections together?
Market structure describes how price develops a sequence of highs and lows. A trader may use that sequence to form a view about whether the market is continuing in its current direction or showing signs of possible change. Fibonacci projections add another reference by extending a measured price movement to identify areas that may deserve attention.
These tools answer different questions. A structure event asks, “What has price recently confirmed or challenged?” A projection asks, “Where might the current movement be measured or compared?” Reviewing both can make chart analysis more deliberate, but the two readings should not be treated as independent proof of a future outcome.
| Review element | What it describes | How to use it carefully |
|---|---|---|
| Market structure | The relationship between recent highs, lows and directional movement | Use it to establish context before examining a potential setup |
| BOS | A break that may indicate continuation or a meaningful structural event | Check the timeframe, location and surrounding price action |
| CHoCH | A possible change in the behaviour or direction of structure | Treat it as an alert for review rather than automatic confirmation |
| Fibonacci projection | A reference created by extending a measured price movement | Compare it with structure and volatility instead of using it alone |
| Risk and target references | Levels that can help organise scenario planning | Assess whether the references fit the trader’s own rules and risk tolerance |
Understanding BOS and CHoCH in context
What a Break of Structure can suggest
A Break of Structure, commonly shortened to BOS, is generally used to describe price moving beyond a relevant prior structural point. In a continuing trend, a BOS may support the interpretation that the existing directional movement remains active. However, the meaning depends on which swing point was broken, the timeframe being reviewed and whether the move has meaningful follow-through.
An indicator can make these events easier to identify consistently, especially when the chart contains several overlapping swings. That convenience does not remove the need to inspect the underlying candles and broader context. A small movement on a lower timeframe may look significant locally while having little relevance to the wider chart.
What a Change of Character can suggest
A Change of Character, or CHoCH, is often used to flag a possible shift in the way price is forming structure. It may draw attention to a market that is no longer behaving as it did during the previous directional move. That makes CHoCH useful as a prompt for further investigation.
It should not automatically be read as a completed reversal. Price can produce a structural change and then return to the prior range, continue through a period of uncertainty or create a new event on another timeframe. A careful review records the event, then asks whether momentum, trend context and subsequent price action support the initial interpretation.
How Fibonacci projections fit into the review
Fibonacci projections are reference levels derived by measuring a price movement and extending that measurement. They are commonly used to organise potential continuation areas or to compare the scale of a current move with a previous one. The value of a projection in a review comes from its role as a reference point, not from assuming that price must reach it.
When a market structure indicator displays Fibonacci projections, the trader can compare the projected area with the latest BOS or CHoCH. For example, a continuation-style structure event may lead to a review of where the current move could be measured. A possible CHoCH may instead encourage the trader to examine whether the projection remains relevant or whether the market context has changed.
Projection alignment is not confirmation
Two chart features appearing near one another can make a scenario more interesting, but proximity alone does not validate the scenario. The projection may be based on a swing that is no longer relevant. The structure event may be sensitive to timeframe settings. Volatility may also expand or contract after the reference is drawn.
A useful question is not “Does the projection predict the next target?” but “What does this reference add to my existing analysis?” If it adds only visual confidence without changing the quality of the evidence, it should not be given more weight than it deserves.
A practical review framework for a market structure indicator
1. Define the chart context
Begin by recording the instrument, timeframe and chart conditions being reviewed. Do not compare an event from one timeframe with a projection from another without explaining why the combination is relevant to the analysis. Multi-timeframe information can be useful, but it can also create conflicting signals if the timeframes are treated as interchangeable.
Next, identify whether the market is showing a clear directional sequence, a broad range or less orderly movement. A market structure indicator may present events in all three conditions. The same BOS label can have a different analytical meaning depending on whether it occurs within a well-defined trend or inside a congested range.
2. Identify the structural event
Record whether the event is labelled BOS, CHoCH or another structural reference available in the indicator. Note which prior high or low was involved and whether the break occurred with visible momentum. Avoid reducing the review to the label alone. The location of the event and the price behaviour around it are part of the evidence.
If the event conflicts with a higher-timeframe trend assessment, keep both observations visible. The conflict may reflect a short-term change within a longer trend rather than a complete market reversal. A structured journal can help prevent one lower-timeframe signal from replacing the full chart context.
3. Examine the projection reference
Review which movement appears to have been used for the Fibonacci projection. Ask whether the swing points are clear, whether the measurement still reflects current price action and whether the projected area is close to a meaningful structural reference. If the basis of the projection is unclear, confidence in the resulting reference should remain limited.
Some indicator tools also provide volatility-based target and risk reference levels. These can support scenario organisation by adding another way to frame the potential scale of movement. They remain references rather than instructions, and they should be considered alongside the trader’s own risk process.
4. Look for agreement and disagreement
Agreement may occur when the structure event, trend assessment, momentum reading and projection point toward a similar scenario. Disagreement is equally important. For instance, a bullish structural event may appear while momentum is weak or while the higher timeframe remains uncertain. Recording that disagreement produces a more balanced review than focusing only on supportive signals.
- Is the structure event consistent with the broader trend assessment?
- Does the projection use a swing that still matters on the chart?
- Are momentum and relative-strength readings supportive, neutral or conflicting?
- Does the market appear directional, ranging or unsettled?
- What observation would invalidate the current interpretation?
5. Define the scenario before considering an action
A scenario describes what the trader believes could happen and what evidence would support or weaken that view. It is different from a guaranteed forecast. A written review might state that continuation is being considered while the latest BOS remains respected, or that a possible reversal deserves attention after a CHoCH and additional confirmation.
This step helps separate analysis from execution. The indicator can assist with organising chart information, but a trader still needs personal rules for position sizing, risk, timing and whether a setup is appropriate at all. The tool is not a substitute for those decisions.

Using smart money concepts without overinterpreting them
Smart money concepts are often used to discuss market structure, liquidity, institutional activity and the behaviour of larger participants. In practice, these ideas can provide a vocabulary for reviewing BOS, CHoCH, flow and momentum. They do not provide direct knowledge of every participant’s intentions, and an indicator reading should not be presented as proof that a particular institution has entered or exited a position.
A smart money indicator can make several related observations available in one TradingView workspace. The advantage is organisation: trend analysis, momentum evaluation, market structure, market flow and related references can be reviewed together. The responsibility is interpretation. A combined display may be useful, but more information does not automatically mean greater certainty.
Separate observation from explanation
“Price broke a prior swing and the tool marked BOS” is an observation. “Institutions are definitely accumulating” is an explanation that goes beyond what a chart event can establish by itself. Keeping those statements separate helps create more disciplined analysis and reduces the temptation to turn a technical label into a confident narrative.
How a TradingView indicator can support the process
AKMelytics – Smart Money Indicator is described as a TradingView technical analysis tool combining algorithms related to momentum, trend analysis, market structure, market flow, relative strength and smart money concepts. Its listed features include multi-timeframe analysis, BOS and CHoCH events, Fibonacci projections, volatility-based target and risk reference levels, dashboard context and configurable TradingView alerts.
Those features can support a repeatable review workflow. A trader might first use the dashboard to orient themselves, then inspect the relevant timeframe, review the structural event and compare the projection with the surrounding price action. Alerts may help draw attention to a configured event, but an alert is a notification—not a complete analysis or a financial recommendation.
| Stage | Possible indicator support | Trader’s responsibility |
|---|---|---|
| Orientation | Dashboard and multi-timeframe context | Decide which information is relevant to the current review |
| Structure review | BOS and CHoCH events | Inspect the swing, timeframe and follow-through |
| Projection review | Fibonacci and volatility-based references | Check the measurement and fit with current conditions |
| Monitoring | Configurable TradingView alerts | Respond according to predefined rules rather than reacting automatically |
| Decision process | Combined trend, momentum and flow context | Apply independent risk management and judgment |
Common mistakes when combining structure and projections
Treating every event as equally important
Not every swing carries the same significance. A minor intraday break may not alter a larger market structure. Review the scale of the event and compare it with the timeframe and chart context before assigning it major importance.
Assuming a projection is a destination
A Fibonacci projection is a reference, not a mandatory price destination. Price may stop before reaching it, pass through it or reverse after briefly interacting with it. The projection should be part of a scenario rather than the sole reason for a trade decision.
Ignoring settings and visual clutter
Configurable tools can display a substantial amount of information. If too many events, alerts or reference levels are shown at once, the chart may become difficult to interpret. Use settings that make the review understandable and verify what each label represents before relying on it.
Confusing an alert with confirmation
An alert can improve awareness of a selected condition, but it does not confirm the quality of the broader setup. The event still needs to be reviewed against trend, momentum, structure, projection validity and personal risk rules.
Using hindsight as evidence
Once a chart has moved, structural events and projections can appear obvious. A fair review should consider what was visible at the time, including uncertainty and conflicting information. Journaling screenshots or written observations can help distinguish a repeatable process from hindsight interpretation.
Questions to include in a review journal
A journal does not need to predict the market. Its purpose is to make the reasoning visible and test whether the same process is being applied consistently. Useful fields include:
- What was the prevailing structure before the event?
- Which swing produced the BOS or CHoCH label?
- What timeframe produced the event, and what did the higher timeframe show?
- How was the Fibonacci projection anchored?
- Which readings supported the scenario, and which contradicted it?
- What would have shown that the interpretation was no longer valid?
- Was the final decision consistent with the trader’s risk plan?
Over time, these questions can reveal whether a trader is relying on a particular label, chasing projections or selectively remembering favourable examples. The goal is not to prove that an indicator is always right. It is to understand how the tool fits within a measured analytical process.
Final perspective
Reviewing market structure events and Fibonacci projections together can provide a clearer way to organise technical analysis. BOS and CHoCH can focus attention on changes in price structure, while projections can provide measurement references for the movement under review. Trend, momentum, flow and multi-timeframe context can add further perspective when interpreted carefully.
The central discipline is to preserve uncertainty. No chart label, projection or smart money concept can remove market risk or guarantee an outcome. A TradingView indicator such as AKMelytics – Smart Money Indicator may assist with analysis and monitoring, but traders remain responsible for their own interpretation, risk controls and decisions. The tool is intended to support trading analysis and decision-making, not to provide financial advice.
Frequently asked questions
What is a market structure indicator?
A market structure indicator is a charting tool that helps identify relationships between price highs, lows and structural events. Depending on the tool, it may mark events such as BOS and CHoCH and combine them with trend or momentum context.
What is the difference between BOS and CHoCH?
BOS generally refers to a break of a relevant structural point, often used when reviewing continuation. CHoCH generally highlights a possible change in price behaviour. Neither label should be treated as an automatic forecast or complete confirmation.
How do Fibonacci projections support market structure analysis?
Fibonacci projections provide measurement references by extending a prior price movement. They can be compared with structural events and other chart context, but they do not guarantee that price will reach a projected area.
Can a smart money indicator prove institutional activity?
No. An indicator can organise market flow, structure and smart money-related observations, but a chart reading does not prove the intentions or actions of a specific institution.
Can alerts replace chart analysis?
No. Alerts can draw attention to a configured condition, while the trader still needs to review the timeframe, surrounding price action, projection basis, conflicting signals and personal risk rules.
Is AKMelytics – Smart Money Indicator financial advice?
No. It is a TradingView technical analysis tool designed to support analysis of potential setups and decision-making. It is not a financial adviser and does not guarantee trading results.


Recent Comments