
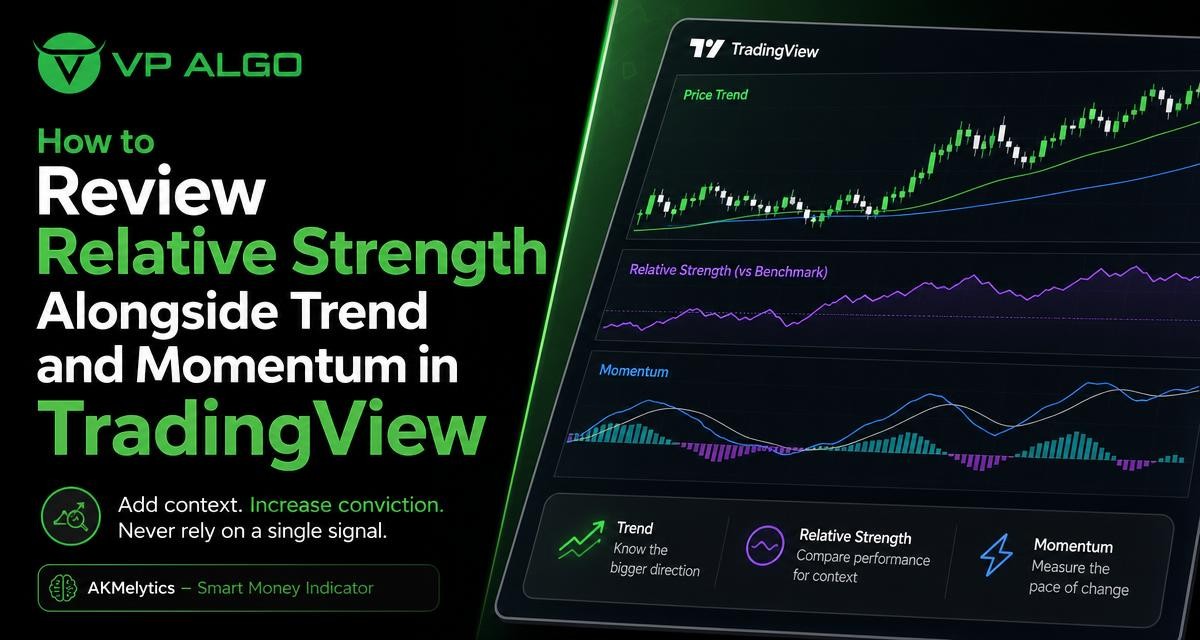
Stock trend analysis becomes more useful when relative strength is reviewed alongside trend direction and momentum rather than treated as a standalone trading signal. In TradingView, these observations can help explain whether an instrument is showing leadership, weakness, continuation potential or a possible loss of participation. The purpose is not to turn one reading into a prediction, but to build a more structured view of market conditions.
What relative strength means in a TradingView review
Relative strength describes how one asset is performing compared with another reference. The reference might be a broad market index, a sector benchmark, a related asset or another instrument on a watchlist. An asset showing relative strength is holding up better or advancing more strongly than its comparison, while an asset showing relative weakness is underperforming the reference.
This idea is different from the Relative Strength Index, commonly called RSI. RSI evaluates the speed and change of price movement within an individual market. Relative strength, in the comparative sense, asks how that market behaves against something else. Both can be useful, but they answer different questions and should not be confused during chart review.
| Observation | Question it helps answer | What it does not prove |
|---|---|---|
| Relative strength | Is this asset outperforming or underperforming a chosen reference? | It does not prove that the move will continue. |
| Trend direction | Is price generally making higher highs and higher lows, or lower highs and lower lows? | It does not identify the exact entry or exit point. |
| Momentum | Is the current price movement gaining or losing force? | Strong momentum can still reverse. |
| Market structure | Has price changed the sequence or organisation of its swings? | A single structure event is not a complete trade thesis. |
Why relative strength should not be reviewed alone
A market can outperform its benchmark while still being in a broader downtrend. For example, an asset may fall less than the index during a weak session and therefore display relative strength, even though its own chart remains below important swing levels. Conversely, an asset can outperform strongly during an advance but begin losing momentum near a level where sellers have previously appeared.
This is why a relative-strength observation should be treated as context. It can help narrow a watchlist or highlight an instrument deserving closer attention, but it does not replace analysis of price structure, trend direction, volatility or risk. A stronger process asks whether the relative-strength reading agrees with the rest of the chart.
Three questions to ask first
- What is the comparison reference, and is it appropriate for the instrument being reviewed?
- Is the observed outperformance occurring in an established trend, a range or a transition?
- Does momentum support the move, or is the relative-strength advantage beginning to fade?
These questions reduce the risk of interpreting a short-term difference in performance as a complete market signal. They also encourage a consistent review process, which is especially useful when several symbols appear attractive at the same time.
Start with the broader trend
Trend analysis provides the framework for interpreting relative strength. On a basic price chart, an uptrend is often associated with a sequence of higher highs and higher lows. A downtrend generally shows lower highs and lower lows. A range may have repeated reactions between broadly defined support and resistance areas without a clear directional sequence.
Relative strength has a different meaning in each environment. In an uptrend, outperformance may support the view that buyers are maintaining interest. In a downtrend, temporary outperformance may simply mean that the asset is declining more slowly than its peers. In a range, relative strength can identify the side of the range that is currently attracting more attention, but the market may still lack directional follow-through.
Use multiple timeframes to separate context from movement
A practical TradingView review can begin with a higher timeframe to identify the prevailing structure, then move to a lower timeframe to study the current setup. The higher timeframe helps prevent a short-lived rally from being mistaken for a major trend change. The lower timeframe can show whether momentum is building, stalling or breaking down inside that larger context.
Multi-timeframe analysis does not make a conclusion certain. It simply helps organise observations. When timeframes disagree, the disagreement itself is useful information. It may indicate a pullback, a developing transition, a range or a market that requires patience rather than immediate interpretation.
Evaluate momentum after identifying direction
Momentum describes the force and pace behind a price move. A rising market with expanding momentum may have stronger participation than a rising market whose movement is becoming increasingly hesitant. Likewise, a falling market with weakening downside momentum may be approaching a period of consolidation, although that does not automatically mean a reversal is underway.
A momentum indicator for TradingView can help organise this part of the review. Depending on the tool and settings, momentum may be represented through oscillator behaviour, changes in price acceleration, signal conditions or other calculations. The exact reading should be considered alongside the chart rather than interpreted as a universal command to buy or sell.
Look for agreement and disagreement
- Relative strength and momentum agree: the asset is outperforming its reference while price movement remains supportive. This may place the instrument higher on a watchlist for further review.
- Relative strength is positive but momentum fades: the asset is still holding up better than the reference, but the pace of movement may be slowing. This can call for closer observation rather than immediate commitment.
- Momentum improves but relative strength remains weak: the asset may be recovering from a period of underperformance. The move may need additional confirmation from trend and structure.
- Both measures weaken: the asset may be losing leadership and should be reviewed against its key price levels and broader market conditions.
These combinations are descriptive, not guaranteed outcomes. Their value comes from helping traders explain what is happening on the chart and identify which questions need further investigation.
Read relative strength through market structure
Market structure adds detail to the relationship between price and comparative performance. Events such as a break of structure or a change of character can show that the prior sequence of swings is being challenged. They are most useful when considered with the location of price, the timeframe and the quality of the preceding move.
For example, relative strength may look constructive while price remains below a recent lower high. In that situation, the asset is outperforming its reference but has not necessarily changed its own bearish structure. A more complete review would ask whether price can reclaim a meaningful swing area, whether momentum supports the attempt and whether the move holds after the initial reaction.
Separate leadership from confirmation
Relative strength can identify leadership before a chart appears technically strong in every respect. That makes it useful for generating ideas, but leadership is not the same as confirmation. Confirmation may involve a sustained trend, a supportive market structure event, continued momentum or evidence that the asset is holding important areas rather than only making a brief move.
The reverse is also true. A chart can have a clean structure while losing relative strength against its benchmark. This may suggest that the asset remains technically organised but is no longer among the strongest candidates in the group. Comparing both dimensions can help distinguish a technically valid chart from a chart with stronger opportunity cost concerns.

A practical TradingView workflow
The following process can make relative-strength review more consistent. It is designed as an analytical framework, not as a mechanical trading strategy.
- Choose the reference. Define what the asset will be compared with and keep that reference consistent during the review. A poorly chosen comparison can make the result difficult to interpret.
- Identify the higher-timeframe trend. Mark the broad sequence of highs and lows and note whether price is trending or ranging.
- Review relative performance. Decide whether the asset is outperforming, underperforming or moving broadly in line with the reference.
- Check momentum. Look for evidence that the current move is gaining force, holding steady or losing energy.
- Inspect market structure. Review recent swing breaks, changes of character and the areas where price has reacted before.
- Assess volatility and location. A strong move near a major reaction area may behave differently from a similar move in open space. Volatility-based reference levels can help organise this observation, but they do not forecast the result.
- Define what would change the view. Record the price behaviour or structural development that would invalidate the current interpretation.
- Review the lower timeframe carefully. Use it to refine understanding of the current movement, not to ignore the higher-timeframe context.
This workflow encourages evidence to be gathered in stages. It also helps avoid switching between indicators until one produces the preferred answer. A disciplined review can acknowledge uncertainty instead of forcing every chart into a bullish or bearish label.
How a combined indicator can support the review
A tool such as the AKMelytics – Smart Money Indicator is designed to bring several analytical elements into a TradingView workflow. Its described features include trend analysis, momentum evaluation, market structure, market flow, relative strength and smart money concepts. It also includes multi-timeframe analysis, BOS and CHoCH structure events, Fibonacci projections, volatility-based target and risk reference levels, dashboard context and configurable TradingView alerts.
The practical benefit of a combined view is organisation. Instead of checking each concept in isolation, a trader can review how the observations relate to one another. A dashboard may help provide context, while structure events can draw attention to changes in price behaviour and alerts can support monitoring. These features should still be interpreted by the user and are intended to support analysis and decision-making, not to provide financial advice or guarantee results.
Questions to apply when using an indicator
- What does the indicator show about the higher-timeframe trend?
- Is the relative-strength observation consistent with the broader market context?
- Does the momentum reading support the current price direction?
- Has market structure changed, or is price still moving within the previous sequence?
- Where are the important reaction areas and what would invalidate the interpretation?
These questions keep the indicator in its proper role: a way to structure chart information. They also reduce the temptation to treat a coloured signal, alert or dashboard label as conclusive without examining the underlying price behaviour.
Common mistakes in relative-strength analysis
Confusing relative strength with RSI
Because the names are similar, traders sometimes assume that relative strength and RSI provide the same information. They do not. Comparative relative strength focuses on performance against a reference, while RSI is an oscillator based on an instrument’s own price changes. Knowing which concept is being used prevents incorrect conclusions.
Using an inconsistent benchmark
Changing the reference from one chart to another can produce observations that are difficult to compare. The benchmark should have a clear reason for being included. If the reference does not represent the market, sector or relationship being studied, its signal may add confusion rather than context.
Ignoring the timeframe
An asset can be relatively strong over one period and weak over another. A short-term improvement does not necessarily alter a longer-term trend. Always record the timeframe behind the observation and compare it with the timeframe used for the broader trend assessment.
Assuming outperformance means a low-risk opportunity
Relative strength describes behaviour, not risk. A strong asset can still experience sharp volatility, pullbacks or structural failure. Risk references and invalidation points should be considered separately, and no indicator can remove the possibility of loss.
Collecting too many signals
Adding more indicators does not automatically improve analysis. When several tools measure similar aspects of price, their agreement may appear stronger than it really is. A smaller set of clearly understood observations is often easier to review than a crowded chart with conflicting labels.
Creating a repeatable review checklist
A written checklist can help turn stock trend analysis into a repeatable process. Before drawing a conclusion, record the instrument, reference, timeframe and current trend. Then note whether relative strength is improving or deteriorating, whether momentum confirms the latest move and whether market structure has changed.
It is also useful to write a neutral explanation before considering any action. For example: “The asset is outperforming its reference, but the higher-timeframe structure remains unresolved and momentum is mixed.” This style of note is more informative than a simple bullish or bearish label because it preserves the conditions behind the interpretation.
| Review area | Example note | Follow-up question |
|---|---|---|
| Trend | Higher-timeframe swings are directional or still range-bound. | Is the current move aligned with that direction? |
| Relative strength | Performance is stronger, weaker or similar to the reference. | Has the relationship persisted across the selected timeframe? |
| Momentum | Momentum is expanding, stable or fading. | Does price still have support from current movement? |
| Structure | Recent swing sequence remains intact or has been challenged. | What price behaviour would confirm or invalidate the view? |
| Risk context | Volatility and reaction areas are identified. | Is the potential interpretation clear enough to monitor? |
The checklist is not intended to produce certainty. Its purpose is to make assumptions visible and encourage a measured review of competing evidence.
Final perspective
Relative strength can add valuable context to TradingView analysis when it is combined with trend, momentum and market structure. It can help identify assets that are leading or lagging, but it cannot independently establish direction, timing or outcome. The most useful interpretation comes from asking whether comparative performance agrees with the price structure and whether momentum supports the observation.
For traders who want a more organised chart workflow, a combined TradingView indicator such as AKMelytics – Smart Money Indicator can bring relative strength, trend analysis, momentum, market structure and other contextual features into one review. The tool remains an aid for analysis and decision-making. A careful process still requires independent evaluation, defined invalidation points and an understanding that market conditions can change.
Frequently asked questions
What is relative strength in stock trend analysis?
Relative strength is a comparison of one asset’s performance with a chosen benchmark or reference. It shows whether the asset is outperforming, underperforming or moving broadly in line with that reference.
Is relative strength the same as the Relative Strength Index?
No. Comparative relative strength evaluates performance against another asset or benchmark. The Relative Strength Index is an oscillator that evaluates price changes within one instrument.
How should relative strength be combined with momentum?
First identify whether the asset is outperforming or underperforming its reference. Then check whether momentum is supporting the current price movement or beginning to fade. Agreement provides context, but it does not guarantee continuation.
Why does timeframe matter when reviewing relative strength?
An asset can be strong over a short period but weak over a longer one. Matching the relative-strength timeframe with the trend and momentum timeframes helps prevent short-term movement from being mistaken for a major trend change.
Can a TradingView indicator confirm a trade by itself?
No. An indicator can organise observations and highlight conditions for further review, but it cannot remove uncertainty or guarantee an outcome. Trend, structure, momentum, volatility and risk should still be evaluated.
What does AKMelytics – Smart Money Indicator help analyse?
According to its described features, AKMelytics combines trend analysis, momentum, market structure, market flow, relative strength and smart money concepts, along with multi-timeframe context and configurable TradingView alerts.


Recent Comments