
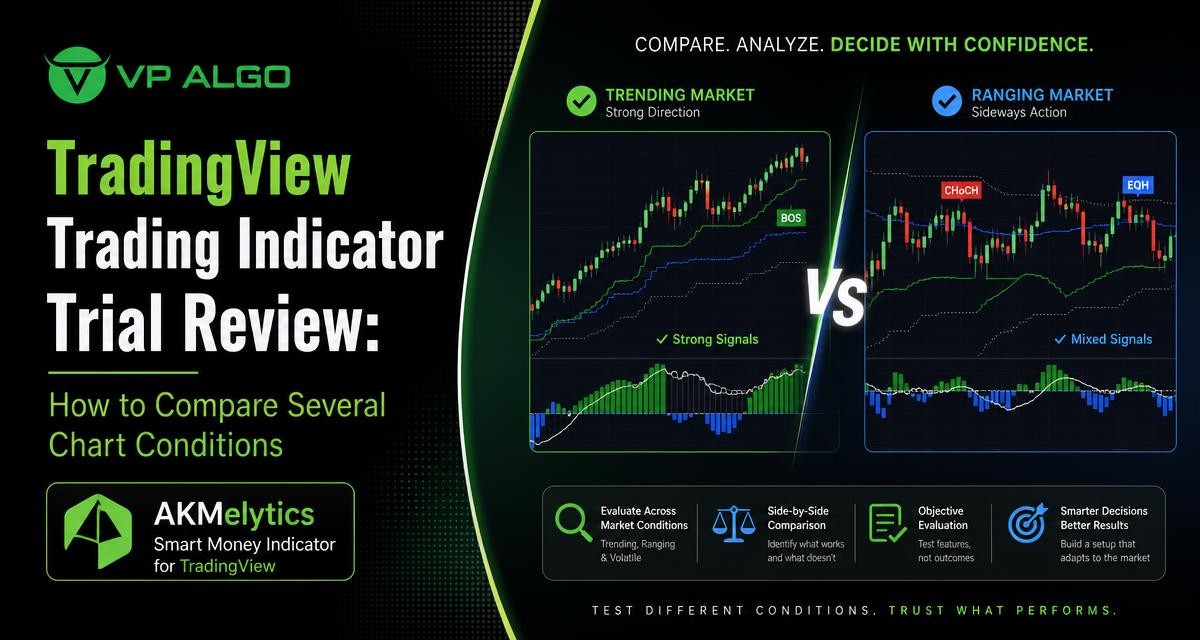
A TradingView trading indicator should be evaluated across more than one attractive chart example. During a trial, the more useful question is whether the tool presents consistent, understandable information when trend, momentum, market structure and market flow conditions change. This review method is designed for traders assessing the AKMelytics – Smart Money Indicator from VP ALGO TRADING, while keeping the evaluation focused on process rather than promised outcomes.
Why one chart example is not enough
A single chart can make almost any indicator appear convincing. If the market has already moved clearly in one direction, signals and structure markings may look easy to interpret. That example may still tell you very little about how the same TradingView trading indicator behaves during consolidation, a reversal attempt, a volatile move or a period of conflicting timeframes.
The purpose of a trial is not to search for a perfect signal. It is to understand what the indicator displays, how quickly you can interpret it, which features are relevant to your analysis and where the information becomes less clear. A balanced review should include several chart conditions and record observations before reaching a conclusion.
What to assess in the AKMelytics – Smart Money Indicator
AKMelytics – Smart Money Indicator is designed to bring several areas of technical analysis into one TradingView tool. Its stated features relate to momentum, trend analysis, market structure, market flow, relative strength and smart money concepts. It also includes multi-timeframe analysis, BOS and CHoCH structure events, Fibonacci projections, volatility-based target and risk reference levels, dashboard context and configurable TradingView alerts.
These features should be assessed separately rather than treated as one combined signal. For example, a trend view may provide directional context, while a structure event describes a change in price organisation. Momentum and relative strength may add another layer of context, but they should not automatically be interpreted as a trade instruction. Separating the functions makes the trial easier to understand.
| Feature area | What to examine during the trial | Useful review question |
|---|---|---|
| Trend analysis | How the indicator presents directional context on different timeframes | Can you identify the current trend view without excessive chart clutter? |
| Momentum and relative strength | How momentum information changes during continuation, slowdown and reversal attempts | Does the display add context to price action that you can explain? |
| Market structure | BOS and CHoCH events, their placement and their relationship to visible price movement | Can you distinguish a structural event from a routine fluctuation? |
| Market flow and smart money concepts | How flow-related information is displayed alongside other conditions | Does the feature help organise your analysis without encouraging certainty? |
| Multi-timeframe dashboard | Whether higher- and lower-timeframe information is easy to compare | Can you see when timeframes agree or conflict? |
| Alerts and reference levels | How configurable alerts, Fibonacci projections and volatility-based levels fit your workflow | Are these tools useful for monitoring and planning rather than chasing movement? |
A practical trial method for several chart conditions
1. Establish a consistent review process
Before opening multiple charts, decide what you are testing. You might evaluate clarity, timing of displayed events, multi-timeframe context, ease of use and whether the dashboard reduces or increases confusion. Write these criteria down so that a visually impressive chart does not change your standard halfway through the review.
Use the same basic observation process for each chart. First describe the visible market condition without the indicator. Then review what the indicator adds. Finally, record whether the additional information was clear, relevant and easy to explain. This approach helps distinguish useful context from information that merely looks sophisticated.
2. Review a clear directional trend
Begin with a chart showing sustained directional movement. This is often the easiest environment in which to understand a trend indicator for TradingView. Look at how the trend view, momentum information and market structure events appear together. Notice whether the dashboard gives a coherent summary across timeframes or whether the information becomes crowded.
Do not judge the tool only by whether it appears to agree with a move that has already happened. Instead, ask whether the display helps you describe the condition at the time you are reviewing it. A useful observation might be that trend and momentum are aligned on one timeframe but less consistent on another. Recording that distinction is more informative than labelling the entire chart as successful or unsuccessful.
3. Examine a sideways or consolidating market
Consolidation is an important test because directional tools can be easier to interpret when price is already moving cleanly. During a range, observe how frequently structure events appear, whether momentum readings alternate, and how the dashboard communicates disagreement between timeframes.
This condition can reveal whether you can recognise uncertainty instead of forcing a directional interpretation. If the chart contains several features, determine which ones remain useful for describing the range and which ones you would set aside. A smart money indicator for TradingView should be assessed on its ability to support disciplined observation, not on whether it removes ambiguity from a naturally ambiguous market.
4. Test a momentum expansion
Next, review a period in which price moves more rapidly after a quieter phase. Assess the relationship between momentum information, market flow context and structure events such as BOS. Consider whether the display helps you understand that movement after it begins, and whether the information remains readable when several chart elements update close together.
Also examine volatility-based target and risk reference levels as reference tools rather than fixed promises. The relevant question is whether these levels help you organise a chart review and define what you are observing. They should not be treated as guarantees of where price will move or as a substitute for personal risk assessment.
5. Review a possible reversal or structure change
A reversal attempt provides a useful setting for examining CHoCH events and other market structure information. Start by describing the prior trend, then note when the chart begins to show a different organisation of price movement. Compare the structure display with momentum and multi-timeframe context.
The goal is not to declare that every CHoCH marks a completed reversal. Instead, check whether the event is understandable and whether you can place it within the broader chart context. A structure label should be treated as analytical information to investigate, not as proof that a future move must follow.
6. Compare conflicting timeframes
Multi-timeframe analysis deserves its own test. Review a chart where the broader view and the shorter view do not point in the same direction. This is common in real analysis and often more revealing than a chart where every timeframe agrees.
Look at how the dashboard presents the conflict. Can you quickly identify which timeframe is showing the broader trend and which is showing a shorter-term change? Can you explain the disagreement in plain language? If the indicator gives you more information but makes your process less clear, that is an important trial finding.
How to record observations objectively
A simple review log can prevent memory from being dominated by the most visually striking chart. Record the chart condition, timeframe combination, features reviewed and your interpretation. You can also note whether a feature was clear, unclear or not relevant to that condition.
| Review item | Example observation format |
|---|---|
| Market condition | Directional trend, range, momentum expansion or reversal attempt |
| Trend context | Higher timeframe and lower timeframe appear aligned or conflicted |
| Structure events | BOS or CHoCH was visible and could be related to price movement |
| Momentum and flow | Information supported, contradicted or did not materially change the review |
| Dashboard clarity | Easy to read, required adjustment or created excess information |
| Alerts and levels | Relevant for monitoring and planning, or not useful for this chart condition |
| Next question | What would you need to investigate before making any decision? |
Avoid scoring the indicator only by counting displayed signals or comparing isolated outcomes. A better trial record explains how each feature behaved and whether you understood its role. This is particularly important for traders who are new to smart money concepts and for experienced participants who already have a defined technical analysis process.
Questions to ask before choosing a TradingView trading indicator
Does the indicator match your analytical workflow?
A tool can include many functions and still be unsuitable for your process. Consider whether you prefer a compact chart, a dashboard-led review, multi-timeframe context or detailed structure markings. The best fit depends on how you analyse charts, not simply on the number of features available.
Can you explain what each feature means?
Before relying on a market structure indicator, make sure you understand the terms and events it displays. You should be able to explain the difference between trend context, momentum information and a structural event. If a label influences your decision but you cannot describe its role, spend more time learning the feature before using it.
Does it support decisions without replacing judgement?
VP ALGO TRADING positions its indicators as tools for educational and trading-decision assistance rather than financial advice. A TradingView indicator can organise information, but it does not remove market uncertainty or guarantee a result. Your review should therefore focus on clarity and process support instead of searching for certainty.
Are alerts used as reminders rather than automatic instructions?
Configurable TradingView alerts can help monitor conditions, but an alert is not the same as a complete analysis. During the trial, consider whether alerts fit your review routine and whether you can verify the wider context before acting on information they draw to your attention.
Using the available trial responsibly
The website offers a request-based 7-day free trial for the indicator and Telegram channel. Because the trial is limited in duration, prepare your review criteria before requesting access. This allows you to spend the available period comparing chart conditions instead of trying to decide what to test at the last moment.
After purchase, customers are instructed to provide their TradingView ID by email for product access. Support can be contacted for installation, activation or usage assistance. These practical steps are separate from the analytical evaluation itself, so keep access questions, feature learning and chart observations clearly separated in your notes.
What a balanced conclusion should look like
A useful trial conclusion does not need to say that an indicator is universally good or bad. It can state which features were easiest to understand, which chart conditions required more caution, how the multi-timeframe display fit your process and whether the tool added useful organisation to your existing analysis.
For the AKMelytics – Smart Money Indicator, a balanced review should consider its combination of trend analysis, momentum, market structure, market flow, relative strength and smart money concepts. It should also consider whether the additional tools, including Fibonacci projections, volatility-based reference levels, dashboard context and alerts, make your review more structured. None of these observations should be presented as a promise of profits or as evidence that future results are guaranteed.
Frequently asked questions
What is a TradingView trading indicator?
A TradingView trading indicator is a chart-based analysis tool used to organise information such as trend, momentum or market structure. It supports analysis but does not provide financial advice or guarantee trading results.
What is a smart money indicator for TradingView?
A smart money indicator for TradingView presents information associated with smart money concepts and related market behaviour. Its usefulness depends on how clearly you understand and apply the information within your own analysis process.
How should I test an indicator during a trial?
Review it across several conditions, including a clear trend, consolidation, momentum expansion, a possible reversal and conflicting timeframes. Record what each feature adds instead of judging the tool from one chart.
What do BOS and CHoCH mean in an indicator review?
BOS refers to a break of structure, while CHoCH refers to a change of character. When displayed by an indicator, these events should be studied in their wider price and timeframe context rather than treated as guaranteed future signals.
Can alerts replace chart analysis?
No. Alerts can help you monitor a condition, but they do not replace review of trend, momentum, structure, market flow or other relevant context.
Does the indicator guarantee profitable trades?
No. VP ALGO TRADING does not position its indicators as guarantees of profits or as a way to eliminate trading losses. Market decisions remain subject to uncertainty and personal risk management.
How can I get access to the available trial?
The website offers a request-based 7-day free trial for the indicator and Telegram channel. Review the current request process directly with VP ALGO TRADING before beginning your evaluation.


Recent Comments