
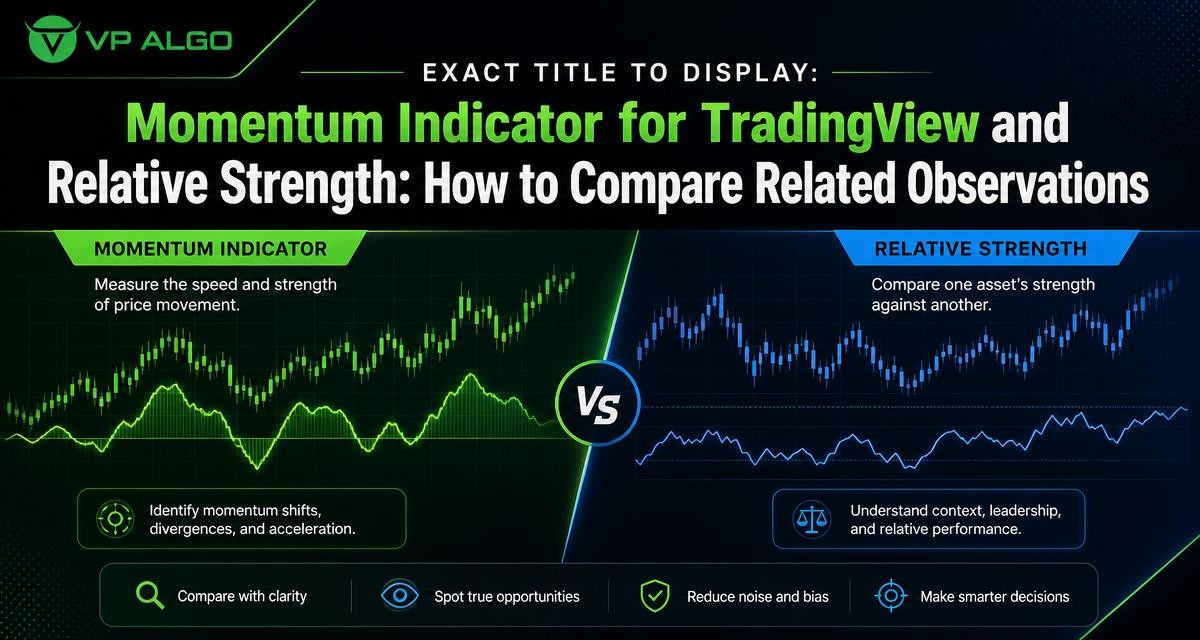
A momentum indicator for TradingView can help traders study the speed and persistence of price movement, while relative strength provides context about how one asset is behaving compared with another reference. These observations are related, but they do not answer exactly the same question. Understanding the difference can make stock trend analysis more structured and reduce the risk of treating every positive or negative reading as a complete trading signal.
Momentum and relative strength answer different questions
Momentum generally describes the force, direction, or rate of change in an asset’s price. A momentum reading may help a trader assess whether a move is accelerating, weakening, or continuing after a breakout. It is usually focused on the asset’s own price behaviour over a selected period.
Relative strength adds a comparison. Instead of asking only whether an asset is rising, the trader asks whether it is performing more strongly or weakly than a benchmark, another asset, an index, or a chosen reference series. An asset may be rising but still underperforming its benchmark. Conversely, an asset may be falling while losing less ground than the broader market, which can be a form of relative resilience.
| Observation | Main question | What it can help describe |
|---|---|---|
| Momentum | How forcefully is price moving? | Acceleration, deceleration, continuation, or loss of short-term pressure |
| Relative strength | How is this asset performing compared with a reference? | Outperformance, underperformance, leadership, or relative resilience |
| Trend structure | What is the shape of the market movement? | Higher highs, lower lows, breaks of structure, and changes in direction |
| Market flow or participation context | What broader conditions may be influencing the move? | Additional context for evaluating a potential setup |
The distinction matters because a strong momentum reading does not automatically mean an asset is a leader. Likewise, relative strength does not necessarily show that price is moving with enough force for a trade idea. The most useful review keeps these observations separate before considering how they fit together.
What a momentum indicator for TradingView can show
A momentum indicator for TradingView is commonly used to organise information about price movement directly on a chart or in a supporting panel. Depending on its design, it may highlight the direction of momentum, shifts in pressure, or conditions in which the current move is becoming less forceful. The exact calculation and display depend on the indicator selected and its settings.
Momentum should be read as an observation rather than a guaranteed forecast. A market can remain strong for longer than expected, and a momentum reading can change while price continues in the same broad direction. For that reason, a momentum review is more useful when paired with price structure, timeframe context, and a clear understanding of what the indicator is actually measuring.
Momentum is about movement, not automatically value
One common mistake is to interpret strong momentum as proof that price is cheap, expensive, or certain to continue. Momentum does not independently establish fair value. It describes the current character of movement according to the indicator’s method.
A rising momentum observation may support the view that buying pressure is increasing or that an existing move remains active. It may also appear late in an extended move. A weakening reading can suggest that the pace of movement is changing, but it does not by itself confirm a reversal. Price structure and the surrounding chart context remain important.
What relative strength adds to chart analysis
Relative strength helps place an asset’s movement in context. A trader can compare an instrument with a benchmark or another reference to identify whether it is leading, lagging, or behaving differently from the wider group. This can be useful when several charts appear to offer similar technical conditions.
For example, two assets may both be above a recent swing level. If one is also outperforming its reference while the other is moving in line with the broader market, their contexts are not identical. Relative strength can help the trader describe that difference without claiming that the stronger asset must deliver a particular future result.
Relative strength is not the same as an oscillator reading
The phrase “relative strength” can sometimes be confused with a momentum oscillator or with an overbought and oversold reading. The terms may appear together in technical analysis, but they describe different ideas. A momentum oscillator often evaluates the speed or change of an asset’s own price. Relative strength compares performance between series.
Before using either observation, check the indicator’s documentation and display. Look at the selected reference, timeframe, calculation method, and any configurable settings. A comparison is only meaningful when the reference and period are understood.
How to compare momentum with relative strength
A practical comparison begins by recording the two observations separately. First, describe the momentum condition of the asset. Then describe how the asset is performing relative to its selected reference. Only after that should you consider whether the two observations support the same broad interpretation.
1. Start with the price and timeframe
Identify the chart timeframe and the price structure visible on it. A momentum observation on a short timeframe may describe a temporary move inside a larger downtrend. A relative-strength comparison may also change depending on the period used. Avoid combining readings from different timeframes without clearly labelling them.
Useful starting questions include:
- Is price making higher highs and higher lows, or lower highs and lower lows?
- Is the current movement occurring near a recent swing, breakout area, or consolidation?
- Does the selected timeframe match the purpose of the review?
- Could a shorter-term momentum shift simply be a pullback within a broader trend?
2. Describe the momentum condition
Next, classify the momentum observation in plain language. It might be strengthening, weakening, mixed, or aligned with the current trend. This description should be based on what the indicator displays rather than on a desired trade outcome.
For example, price may be rising while momentum is beginning to weaken. That combination does not automatically mean a reversal is coming. It does indicate that the latest price movement may deserve closer review, especially if the asset is approaching a significant structural level.
3. Identify relative performance
Then assess whether the asset is outperforming, underperforming, or moving broadly in line with the chosen reference. Be precise about the comparison. Relative strength against a broad index is different from relative strength against a sector, currency, or another individual asset.
It is also useful to consider the duration of the comparison. A chart can show short-term leadership but longer-term underperformance. Both statements may be true, so the review should specify which period is being discussed.
4. Look for alignment or divergence
Alignment occurs when the observations point in a similar direction. For instance, strengthening momentum combined with outperformance may present a more coherent description of current leadership than either observation alone. This is still context, not a promise of continuation.
Divergence occurs when the observations disagree. Price may be rising with weakening momentum, or it may show improving momentum while still underperforming its reference. Divergence is not automatically a trade signal, but it can identify an area for further investigation.
| Momentum observation | Relative-strength observation | Neutral interpretation to investigate |
|---|---|---|
| Strengthening | Outperforming | Price movement and comparative performance are aligned; review structure and risk context. |
| Strengthening | Underperforming | The asset may be improving internally but still lagging its reference. |
| Weakening | Outperforming | The asset remains relatively strong, but the pace of its move may be moderating. |
| Weakening | Underperforming | Both observations show caution, although price structure and timeframe still require review. |
| Mixed or unclear | Mixed or unclear | More context may be needed before drawing a directional conclusion. |

Using the comparison in broader stock trend analysis
Momentum and relative strength become more useful when they are placed within a wider stock trend analysis process. They should not replace the review of price structure, volatility, key levels, and the trader’s own risk process. Their role is to help organise observations and identify questions worth examining.
Confirm the broader trend context
Start by determining whether the chart is trending, consolidating, or transitioning. In a clear trend, momentum can help describe whether the current leg is gaining or losing force. Relative strength can show whether the asset is participating in that trend more strongly or weakly than its reference.
In a range, momentum may shift repeatedly as price moves between boundaries. Relative strength may also change without producing a sustained directional move. Recognising a range can prevent a trader from treating every short-term change as evidence of a new trend.
Review market structure
Market structure provides a framework for testing an indicator observation against price behaviour. Higher highs, higher lows, lower highs, lower lows, breaks of structure, and changes in character can all add context. An indicator reading that is not reflected in price structure should be treated as an observation requiring further review.
Some TradingView tools combine momentum, trend analysis, market structure, market flow, relative strength, and smart money concepts in one review environment. AKMelytics – Smart Money Indicator is described by VP ALGO TRADING as a TradingView technical analysis tool with these types of analysis features, including multi-timeframe analysis and configurable alerts. Its purpose is to support the evaluation of potential setups and decision-making, not to provide financial advice or guarantee results.
Compare multiple timeframes carefully
Multi-timeframe analysis can show whether a short-term momentum change agrees with the higher-timeframe trend. A lower timeframe may show strengthening momentum while the higher timeframe remains bearish. That is not necessarily a contradiction; it may describe a countertrend move or a developing transition.
Write down the timeframe for each observation. This simple step helps prevent a short-term reading from being presented as a long-term conclusion.
Common interpretation mistakes
Assuming outperformance means a buy signal
Outperformance only describes comparative behaviour. It does not establish an entry point, stop level, target, or acceptable risk. An asset can outperform while still moving through a volatile or uncertain structure.
Treating momentum strength as a guarantee
Momentum can persist, fade, or reverse. A strong reading should be considered alongside the location of price, market structure, and the timeframe being analysed. No indicator removes uncertainty from market decisions.
Ignoring the reference used for relative strength
A relative-strength conclusion is incomplete without naming the comparison. “Strong” can mean strong against one benchmark and weak against another. Record the reference and period so the observation can be reproduced and reviewed.
Using too many signals without a decision process
Adding more indicators does not automatically create better analysis. A clearer approach is to assign each tool a specific role. For example, price structure can describe the chart pattern, momentum can describe the pace of movement, and relative strength can describe comparative performance.
A simple TradingView review workflow
The following workflow can help organise a neutral review when using a momentum indicator for TradingView alongside relative-strength information:
- Define the asset, benchmark or reference, and chart timeframe.
- Describe the visible price structure without using the indicator as the explanation.
- Record whether momentum is strengthening, weakening, or mixed.
- Record whether the asset is outperforming, underperforming, or moving in line with the reference.
- Check whether the observations align or diverge.
- Review volatility, key levels, and any market-structure events that may affect interpretation.
- Document the uncertainty and the conditions that would change the analysis.
This process is deliberately descriptive. It does not tell a trader what to buy or sell. Instead, it creates a repeatable way to review related observations before making any decision within a personal trading plan.
Where a combined indicator can fit
A combined TradingView indicator can be useful for traders who want several forms of context displayed in one analytical environment. A tool that brings together momentum, trend, market structure, relative strength, market flow, and smart money concepts may reduce the need to switch between separate chart studies. The benefit depends on how clearly the information is presented and how consistently the trader interprets it.
AKMelytics – Smart Money Indicator is offered by VP ALGO TRADING for TradingView and includes features described as covering momentum, trend analysis, market structure, relative strength, market flow, multi-timeframe context, Fibonacci projections, volatility-based target and risk reference levels, dashboard information, and configurable alerts. These features should be treated as analytical aids. Users still need to understand the settings, validate what each display means, and apply their own risk controls.
Final takeaway
A momentum indicator for TradingView and a relative-strength observation can complement one another, but they should not be treated as interchangeable. Momentum focuses on the character and pace of an asset’s movement. Relative strength places that movement beside a chosen reference. When combined with price structure, timeframe analysis, and a defined review process, they can produce a clearer description of market conditions.
The most reliable comparison is not the one with the most signals. It is the one that states what each observation measures, identifies where the readings agree or diverge, and keeps uncertainty visible. That approach supports more disciplined technical analysis without turning an indicator into a promise about future market results.
Frequently asked questions
What is a momentum indicator for TradingView?
It is a TradingView chart tool used to study the direction, speed, or persistence of price movement. Its exact calculation and display depend on the specific indicator and its settings.
How is momentum different from relative strength?
Momentum examines an asset’s own price movement, while relative strength compares that asset’s performance with a benchmark, another asset, or another reference series.
Does relative strength indicate that an asset will rise?
No. Relative strength describes comparative performance. An asset can outperform its reference while still facing volatility, resistance, weakening momentum, or an unclear trend.
Can momentum and relative strength disagree?
Yes. Price momentum may be improving while the asset continues to underperform its reference, or relative strength may remain positive while momentum begins to weaken. Such divergence is context for further review, not an automatic signal.
Why should timeframe be recorded during the comparison?
Momentum and relative strength can change across timeframes. A short-term improvement may occur inside a broader downtrend, so recording the timeframe prevents a limited observation from being treated as a long-term conclusion.
Can a combined TradingView indicator replace technical analysis?
No. A combined indicator can organise information about momentum, trend, market structure, relative strength, and other conditions, but traders still need to understand the tool, review price behaviour, and apply their own decision and risk process.


Recent Comments