
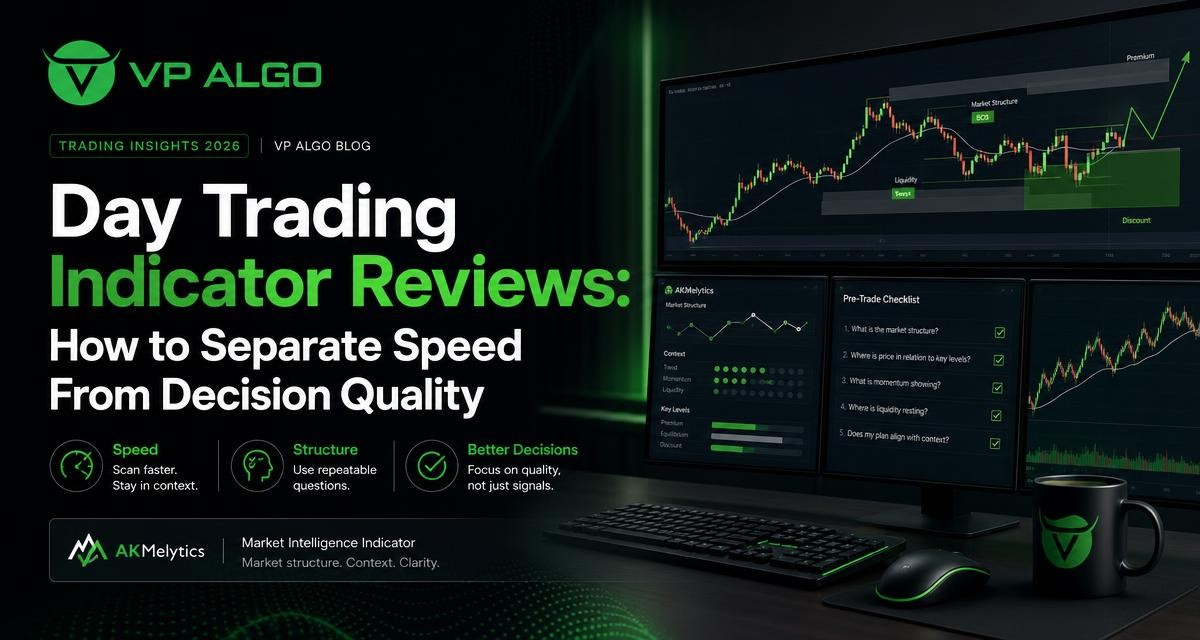
Searching for the Best indicators for day trading TradingView users can apply often leads to a long list of signals, overlays and automated tools. Yet speed is not the same as decision quality. A fast alert may draw attention to a price move, but a structured review asks whether the move fits the broader trend, market structure, momentum and available evidence. That distinction matters when reviewing any day trading indicator, including tools designed to combine several forms of market analysis.
Why speed can be misleading in day trading
Intraday charts change quickly. A candle can break a recent high, reverse through its opening range and close near its low within a short period. Indicators that respond quickly may help traders notice these changes, but they also react to temporary price movement. A quick signal is therefore an observation, not automatically a complete trading decision.
The main risk is allowing an indicator to replace the questions that should come before action. Is the market trending or moving sideways? Is the current price near a meaningful structural level? Does momentum support the move, or is the signal appearing after an extended push? What would invalidate the idea? These questions create context around the output.
What a useful day trading indicator review should examine
A review should look beyond whether an indicator appears visually impressive or produces frequent signals. The more useful test is whether the tool helps a trader follow a repeatable process. That process can be simple, provided it is applied consistently.
| Review area | Question to ask | Why it matters |
|---|---|---|
| Trend | What direction is the broader market condition suggesting? | It helps place short-term movements in a wider context. |
| Momentum | Is participation in the current move strengthening, weakening or unclear? | It prevents a price change from being treated as confirmation by itself. |
| Market structure | Has price formed a meaningful break, range or reversal area? | Structure provides a framework for interpreting isolated signals. |
| Institutional activity | Does the tool offer a way to examine activity or flow conditions? | It can add another perspective, while still requiring careful interpretation. |
| Timeframe agreement | Does the lower-timeframe view conflict with the larger chart? | It highlights when a fast signal may be part of a larger counter-move. |
| Usability | Can the trader explain the signal without relying on visual clutter? | A clear process is easier to review and repeat. |
Start with context before reading the signal
Trend is a framework, not a complete entry rule
A trend indicator for TradingView can help organize the direction of price action, but trend information alone does not answer every intraday question. A market may be moving upward on a broader timeframe while experiencing a sharp pullback on a faster chart. Conversely, a short-term upward move may occur inside a wider decline.
Before treating a signal as meaningful, identify the timeframe that defines the main context and the timeframe used for detailed review. The purpose is not to force every chart into agreement. It is to recognize whether a signal is aligned with the wider condition or is instead a counter-directional event that needs a different level of caution.
Market structure adds sequence and location
A market structure indicator can help traders examine higher highs, lower lows, breaks of recent ranges and possible changes in directional behavior. The important point is that structure has both a sequence and a location. A break in the middle of an uncertain range may carry a different meaning from a break after a sustained directional move or near a previously observed level.
When reviewing structure, ask what price actually changed. Did the market move beyond a recent swing? Did it reclaim or lose an area that had been holding? Was the move confirmed by a close, or did price briefly move through the level and return? These questions reduce the temptation to treat every visual marker as equally important.
Use momentum as supporting evidence
A momentum indicator for TradingView is generally most useful when it supports a broader interpretation rather than operating as an isolated buy or sell instruction. Strong price movement can attract attention, but momentum may also appear late, after much of a move has already taken place. Weakening momentum does not automatically mean that a reversal will follow either.
A practical review compares momentum with price behavior. If price is making new highs while momentum becomes less convincing, that difference deserves attention. If price breaks structure and momentum expands in the same direction, the two observations may provide a more coherent picture. Neither situation removes the need to define risk and invalidation.
How smart money and flow features fit into a review
Smart money concepts and institutional activity features are often used to add another layer to chart analysis. A smart money indicator may present information about market behavior, areas of interest or activity conditions in a way that is easier to review on a TradingView chart. However, terms such as “smart money” should not be treated as proof that a specific group is about to buy or sell.
The useful question is whether the feature helps explain the chart. Does it support the observed trend? Does it highlight a possible area where structure deserves closer examination? Does it conflict with the momentum or timeframe view? Treating institutional flow information as context rather than certainty helps prevent an attractive label from becoming an unsupported conclusion.
Evaluating a multi-factor TradingView indicator
Some tools combine trend analysis, momentum evaluation, market structure, institutional activity, multi-timeframe assessment and smart money analysis. The appeal is clear: instead of switching between unrelated chart studies, a trader can review several dimensions within one framework. The trade-off is that more information can also create more opportunities for confusion.
When reviewing a multi-factor tool such as the AKMelytics – Market Intelligence Indicator, focus on how each component contributes to the decision process. The objective should not be to collect as many signals as possible. It should be to understand which observations are primary, which are supporting evidence and which conditions would make the setup less convincing.
A simple hierarchy for interpreting multiple signals
- Context first: Identify the broader trend or range condition before examining a fast signal.
- Structure second: Check whether price is responding to a meaningful swing, range boundary or structural change.
- Momentum third: Assess whether the force behind the current move supports the structural interpretation.
- Activity as confirmation: Use flow or smart money-related information as an additional perspective, not as a guarantee.
- Decision rules last: Define the entry idea, invalidation point and review conditions before acting.
This hierarchy can be adapted to different trading approaches. Its purpose is to stop a single rapid marker from dominating the entire analysis. It also makes post-trade review more useful because the trader can identify which part of the reasoning was unclear.
Questions that improve chart review speed without sacrificing quality
Speed becomes more useful when it comes from a repeatable checklist rather than from rushing through more indicators. A short set of questions can help traders review a chart consistently:
- What is the main market condition: trend, range, transition or unclear?
- Which timeframe provides the context, and which timeframe provides the execution detail?
- Where is the nearest meaningful structural reference?
- Does current momentum support the direction, weaken it or provide no clear information?
- Is the indicator showing a new development or simply confirming a move that has already extended?
- What would make the original interpretation invalid?
- Can the idea be explained in a few clear sentences without relying on the indicator’s visual design?
These questions are not a trading signal by themselves. They are a way to organize attention. A trader who can answer them consistently is better positioned to compare tools on the quality of their decision support rather than on the number of alerts produced.
Common mistakes when comparing the best indicators for day trading TradingView users can find
Choosing the tool with the most signals
A high number of signals can make an indicator look active and responsive. It can also create repeated decisions in choppy conditions. Signal frequency should therefore be considered alongside clarity, context and the trader’s ability to review each setup.
Confusing visual precision with market certainty
Colored zones, arrows and labels can make a chart easier to scan, but visual precision does not change the uncertain nature of market behavior. A clean interface is valuable when it improves understanding. It becomes misleading when presentation is mistaken for proof.
Ignoring delayed information
Many indicators use price data that becomes clearer only after a candle closes or a structure develops. That is not automatically a flaw. It simply means the trader should understand when a feature becomes available and avoid judging it as though it predicted information that was not yet present.
Mixing too many overlapping indicators
Several tools may describe the same underlying price behavior using different labels. Adding more indicators can create the impression of confirmation without adding independent information. A smaller set of well-understood inputs is often easier to audit than a crowded chart.
Reviewing outcomes without reviewing process
A single successful or unsuccessful trade does not fully explain whether an indicator was useful. Review whether the context was identified correctly, whether the signal was interpreted as intended and whether the decision followed the stated rules. This process-based review is more informative than judging a tool from one result.
How to test an indicator responsibly
Testing should begin with a clearly defined observation process. Write down what counts as an aligned trend, a relevant structure break, supportive momentum and a valid reason to reject the idea. Without definitions, it is easy to change the interpretation after seeing the result.
Use historical chart review or a simulated process to examine different market conditions, including directional movement, consolidation and abrupt reversals. The purpose is not to assume that past observations will predict future results. It is to discover how the indicator behaves, when it becomes ambiguous and whether the trader can apply it consistently.
Also record practical issues. Is the chart easy to read? Are the labels understandable? Does the tool encourage a clear sequence of questions? Can the trader identify what changed between one review and the next? These usability details matter because a theoretically useful indicator may be difficult to apply under time pressure.
Where the AKMelytics indicator may fit
VP ALGO TRADING develops and sells TradingView indicators and algorithmic trading tools for traders who want structured market analysis. The AKMelytics – Market Intelligence Indicator is positioned around several areas relevant to this review, including trend analysis, momentum, market structure, institutional activity, multi-timeframe trend assessment and smart money analysis.
That combination may be relevant to traders who prefer to examine more than one dimension of a chart before forming a view. It should still be treated as decision-support software rather than financial advice. The indicator cannot remove uncertainty, guarantee a result or eliminate the need for risk management and independent judgment. Traders considering the tool should learn how its features work and determine whether the workflow suits their own analysis.
A practical checklist for choosing a day trading indicator
| Checkpoint | What a positive answer looks like |
|---|---|
| Clear purpose | You can explain whether the tool is mainly for trend, momentum, structure, activity or a combination. |
| Understandable output | The labels and chart elements support analysis rather than adding unexplained noise. |
| Repeatable workflow | You can apply the same review questions across different charts and sessions. |
| Known limitations | You understand that signals can be delayed, conflicting or misleading in certain conditions. |
| Independent judgment | You use the tool as one input and can identify when not to act. |
| Suitable pace | The indicator helps you review efficiently without encouraging impulsive decisions. |
The best indicator is not necessarily the fastest, the most complex or the one with the most visible alerts. It is the tool that helps make the reasoning behind a chart review clearer and more repeatable. For some traders, that may mean a focused single-purpose study. For others, a multi-factor indicator can provide a practical framework, provided each component is understood and its limitations remain visible.
FAQ
What are the best indicators for day trading TradingView users can start reviewing?
There is no single best indicator for every trader or market condition. A sensible review may include trend, momentum and market structure, with additional activity or smart money information used as supporting context.
What does a market structure indicator show?
A market structure indicator can help organize price swings, recent highs and lows, range behavior and possible structural breaks. Its output still needs to be interpreted in relation to timeframe and location.
Is a fast indicator better for day trading?
Not automatically. Faster responses may help identify changes sooner, but they can also react to temporary movement. Decision quality depends on context, confirmation and a defined invalidation process.
Can a smart money indicator predict institutional trades?
No indicator should be treated as proof that a specific institution will trade in a particular direction. Smart money or flow-related features are better viewed as an additional perspective on market conditions.
How many indicators should be used on a TradingView chart?
The right number depends on the method and the trader’s ability to understand each input. A smaller group of non-overlapping tools is often easier to review than a crowded chart with repeated information.
What should traders review before acting on an indicator signal?
Review the broader trend or range, relevant market structure, momentum, timeframe alignment and the condition that would invalidate the idea. Then decide whether the signal adds useful information or merely repeats what price has already shown.
Is a TradingView indicator financial advice?
No. A TradingView indicator is a software tool for chart analysis and decision support. It does not replace independent research, risk management or professional financial advice where that is appropriate.


Recent Comments