
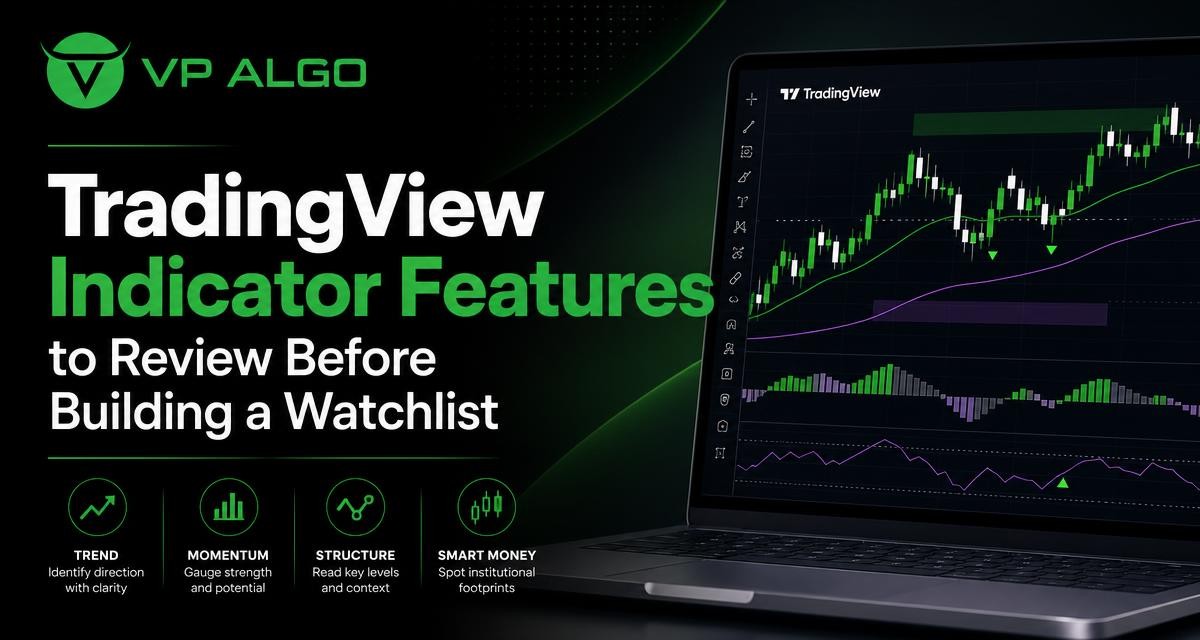
Choosing a TradingView trading indicator is easier when you first decide what information you need from your chart. A useful tool should help you review market conditions in a structured way, rather than simply add more signals to an already crowded layout. Before building a watchlist, assess whether an indicator can give you practical context about trend, momentum, market structure, institutional activity and smart money conditions.
Why indicator features matter before you build a watchlist
A watchlist is more useful when it reflects a repeatable review process. Instead of scanning instruments randomly, you can look for charts that match a defined set of conditions. Those conditions might include a clear directional trend, supportive momentum, a relevant structural level or signs that market activity deserves closer attention.
The indicator itself does not make the decision for you. Its role is to organize information that may otherwise require several chart tools and manual observations. This can be especially helpful for traders who want to compare multiple charts in TradingView while keeping their analysis consistent.
Before selecting a tool, ask four basic questions:
- Does it help identify the broader trend?
- Does it provide useful momentum information?
- Does it show meaningful changes in market structure?
- Does it add context about institutional activity or smart money concepts without encouraging overconfidence?
These questions provide a better starting point than choosing an indicator solely because it displays frequent buy or sell markers.
Core features to assess in a TradingView trading indicator
Different indicators organize information in different ways. Some focus on one technical concept, while others combine several types of analysis. A multi-feature tool may be useful when its components are clearly explained and support the same review process. The key is to understand what each feature is intended to show and how it fits into your own analysis.
Trend analysis
Trend analysis is often the first layer of chart review. A trend feature can help you distinguish between a market moving in a sustained direction and one that is ranging or changing character. This matters because a setup that fits a trending environment may not fit a sideways market.
When assessing a trend indicator for TradingView, look for information that can be read across more than one timeframe. A chart may appear bullish on a short timeframe while the broader structure remains uncertain. Multi-timeframe trend assessment can help you compare these views instead of relying on a single chart interval.
Useful questions include:
- Can the indicator show the current directional bias clearly?
- Can you compare short-term and higher-timeframe conditions?
- Does it distinguish a developing trend from a flat or mixed market?
- Is the display understandable when several charts are open?
A trend reading should be treated as context, not a guarantee that price will continue in the same direction.
Momentum evaluation
Trend and momentum are related, but they are not identical. A market can remain in an upward trend while momentum weakens. It can also show strong short-term movement before a broader trend has been established. A momentum indicator for TradingView can help you examine the strength and consistency behind a price move.
When reviewing momentum features, consider whether they add information beyond a simple directional label. The most useful questions are whether momentum is strengthening, fading or conflicting with the apparent trend. A conflict does not automatically mean a trade should be avoided, but it can signal that the chart needs more careful review.
Momentum readings are also sensitive to timeframe. A strong move on a lower timeframe may be a small movement inside a wider consolidation. For that reason, a good review process should record which timeframe produced the momentum reading and avoid treating it as universal across every chart.
Market structure
Market structure refers to the way price develops swings, breaks and areas of support or resistance. A market structure indicator can make these changes easier to review by drawing attention to significant highs, lows and possible shifts in directional behavior.
Structure features may be particularly useful when you want to distinguish between continuation and a possible change in market character. However, labels and lines should not replace the underlying chart. Review how the indicator identifies a meaningful swing, whether its markings remain readable, and whether the structure shown is appropriate for your selected timeframe.
Before adding an instrument to a watchlist, you might ask:
- Is price making higher highs and higher lows, lower highs and lower lows, or neither?
- Has a notable structural level been broken or merely tested?
- Does the current price location provide enough context for further review?
- Is the structure reading consistent with the broader trend?
These questions help turn a visual chart feature into a repeatable observation rather than a reason to act immediately.
Institutional activity and flow context
Some traders want more than price and momentum readings. They also want to examine possible institutional activity or flow-related context. An institutional flow indicator may organize this information alongside other chart conditions, helping you identify areas that deserve additional attention.
Flow-related features should be interpreted carefully. They do not provide a direct view of every participant’s intentions, and they should not be presented as proof that a particular market will move in a specific direction. Their practical value is in adding another layer of context to a chart review process.
When assessing this type of feature, check whether its signals are easy to distinguish from trend and momentum readings. A chart becomes difficult to use when every concept is represented by overlapping colors, labels or alerts. Clarity is more valuable than a high quantity of visual markers.
Smart money concepts
A smart money indicator for TradingView may bring together ideas such as market structure, liquidity behavior and institutional activity. Traders often use these concepts to study where price may be reacting to areas of interest and how directional conditions are developing.
The important consideration is whether the tool presents smart money concepts in a way that supports analysis rather than implying certainty. The phrase “smart money” should not be treated as a promise that an indicator knows the actions of every large market participant. Review the definitions used by the tool and make sure you understand what each signal represents.
A practical smart money review can include:
- Identifying notable structural changes.
- Observing areas where price has reacted or consolidated.
- Comparing smart money context with the broader trend.
- Checking whether momentum supports or contradicts the interpretation.
- Recording the reasoning behind keeping a chart on the watchlist.
How to compare indicator features before choosing a tool
Feature lists can look impressive, but they do not always show how useful a tool will be during a real chart review. Compare indicators by asking how each one contributes to your workflow. A simple feature that answers a recurring question may be more useful than a complex display that creates additional uncertainty.
| Feature | What it can help you review | Questions to ask |
|---|---|---|
| Trend analysis | Directional bias and changing market conditions | Can I identify the broader trend and compare timeframes? |
| Momentum | Strengthening, weakening or conflicting price movement | Does this reading add context beyond the trend label? |
| Market structure | Swing points, breaks and possible shifts in behavior | Are the marked levels clear and relevant to my timeframe? |
| Institutional flow | Additional context around notable market activity | Is the information presented as context rather than certainty? |
| Smart money concepts | Combined review of structure, liquidity-related ideas and activity | Are the concepts explained well enough to interpret consistently? |
| Multi-timeframe analysis | Comparison between wider and shorter-term conditions | Can I avoid relying on an isolated timeframe? |
This kind of comparison keeps the selection process connected to your actual needs. It also makes it easier to identify gaps. For example, a tool may be strong for momentum but provide little help with structure, while another may offer broader market context but require more manual interpretation.
Using an indicator to screen a watchlist
Once you have selected an indicator, create a simple screening routine. The goal is not to force every chart into the same pattern. The goal is to apply the same questions so that your watchlist reflects information you can explain.
Start with the higher-timeframe view
Begin by checking the wider trend and major structural conditions. This can help you avoid giving too much weight to a short-lived move. Note whether the market appears directional, mixed or range-bound, and record any important structure visible on the chart.
Review momentum next
After identifying the broad context, examine momentum. Is price moving with the apparent trend, or is momentum weakening? If the two readings disagree, mark the instrument for observation rather than assuming that one signal is automatically correct.
Check structure and activity
Look for relevant breaks, swing behavior and areas where activity may deserve further review. If the indicator includes institutional flow or smart money features, use them as supporting context. Avoid treating a single marker as a complete analysis.
Write down the reason for inclusion
A watchlist becomes more useful when every item has a reason for being there. A short note might say that the instrument has a clear higher-timeframe trend, improving momentum and a structural level that needs monitoring. This makes it easier to reassess the chart later without relying on memory.
Common mistakes when reviewing TradingView indicators
Choosing a tool because it produces many signals
Frequent signals may look active, but they can also make it difficult to separate meaningful information from ordinary market noise. Focus on whether the signals help answer a specific question and whether they remain understandable across different conditions.
Using every feature at once
A tool with trend, momentum, structure and smart money features can provide broad context, but you do not have to use every display element simultaneously. Start with the features most relevant to your process. Add further layers only when they improve your understanding.
Ignoring timeframe differences
A reading can change when you move from one timeframe to another. This is normal, not necessarily a flaw. Make the timeframe part of your notes and decide in advance how higher-timeframe context will influence your chart review.
Treating indicators as predictions
Indicators organize historical and current market information; they do not remove uncertainty. No feature can guarantee a market outcome or eliminate the possibility of losses. A disciplined process still requires risk awareness, independent judgment and an understanding of the instrument being reviewed.
Building a watchlist without a review rule
If you add charts whenever a new label appears, the watchlist can grow without becoming more useful. Define what qualifies an instrument for inclusion and what would cause you to remove it. This keeps the list focused and makes follow-up analysis more manageable.
Where AKMelytics fits into this review process
VP ALGO TRADING develops and sells TradingView indicators and algorithmic trading tools, including the AKMelytics – Market Intelligence Indicator. The product is positioned for traders who want a structured way to review market information rather than rely on one isolated technical reading.
When evaluating a tool such as AKMelytics, focus on how its available trend, momentum, market structure, institutional activity, multi-timeframe and smart money features fit your own chart-review routine. Consider whether the information is clear, whether you can explain the signals you see and whether the tool helps you compare potential watchlist candidates consistently.
VP ALGO TRADING also states that its indicators are intended for educational and trading-decision assistance purposes, not as financial advice. Customers who purchase access are instructed to provide their TradingView ID by email, and support is available for installation, activation or usage assistance. A request-based seven-day free trial is also offered for the indicator and Telegram channel; eligibility and arrangements should be confirmed directly with the company.
A practical checklist before adding an indicator to your workflow
Use the following checklist before deciding whether a TradingView trading indicator deserves a place in your regular chart review:
- Define the market questions you want the indicator to help answer.
- Check whether trend information is clear across the timeframes you review.
- Assess whether momentum adds useful confirmation or highlights disagreement.
- Review how market structure is marked and whether the levels remain readable.
- Understand what institutional activity and smart money features actually represent.
- Check whether the display remains usable without excessive labels or visual clutter.
- Test the indicator as a screening and review aid rather than treating it as a prediction tool.
- Record why each chart is added to or removed from your watchlist.
This approach encourages a more deliberate selection process. It also helps you evaluate an indicator based on how well it supports your decisions, rather than how impressive its feature list appears.
Frequently asked questions
What is a TradingView trading indicator?
A TradingView trading indicator is a chart-based tool that organizes market information into visual readings, labels or other features. Depending on the tool, it may help review trend, momentum, market structure, institutional activity or smart money concepts.
What should I look for in a trend indicator for TradingView?
Look for clear directional information, useful timeframe context and a display that helps distinguish trending conditions from mixed or range-bound conditions. The reading should support analysis rather than imply certainty.
Can one indicator cover trend, momentum and market structure?
Some indicators combine these features. The important question is whether each component is clearly explained and useful in your workflow. Multiple features are only helpful when they improve clarity rather than create chart clutter.
How can a smart money indicator support a watchlist?
It can provide additional context around structure, liquidity-related ideas and market activity. Use that information to identify charts for further review, not as proof that a particular outcome will occur.
Should I use multiple timeframes when reviewing an indicator?
Comparing timeframes can help you understand whether a short-term movement agrees with the broader market context. Keep the timeframe visible in your notes because readings may differ across chart intervals.
Does an indicator guarantee profitable trades?
No. An indicator cannot guarantee profits, eliminate losses or replace independent judgment. It is a decision-support and chart-review aid, and market outcomes remain uncertain.
What is the purpose of AKMelytics – Market Intelligence Indicator?
AKMelytics is a TradingView indicator offered by VP ALGO TRADING for traders who want structured market intelligence. Review its available features and support materials to determine whether it fits your own analysis process.


Recent Comments