
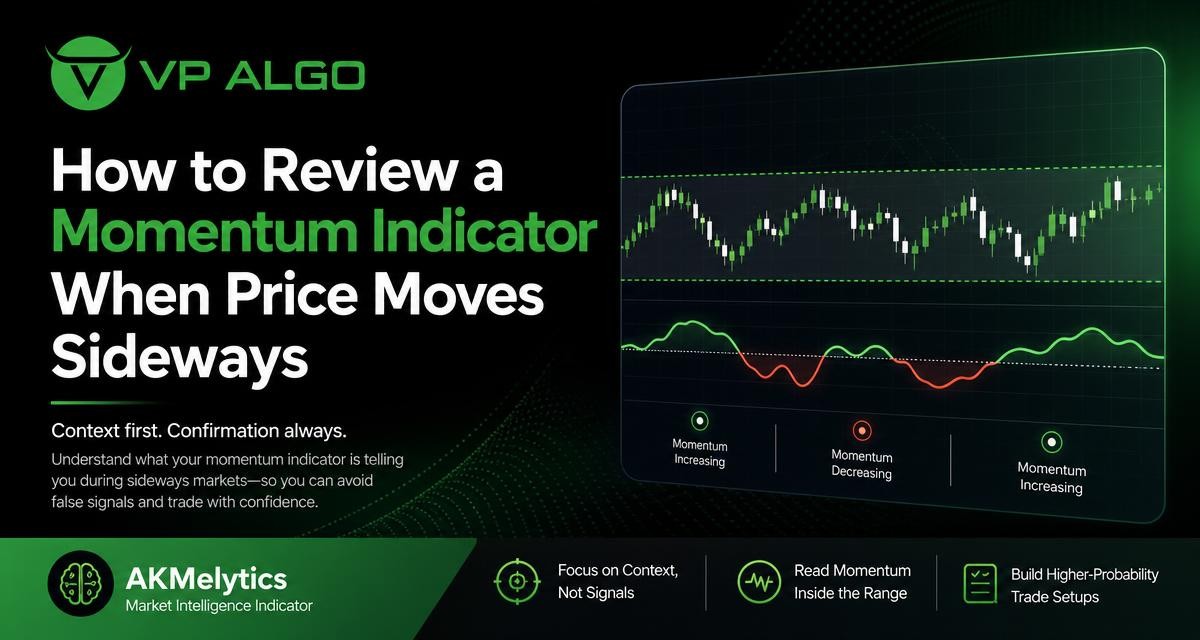
Reviewing a momentum indicator for TradingView becomes more challenging when price moves sideways. In a range, momentum can strengthen briefly near one boundary, weaken near the other, and change direction without producing a lasting trend. The useful question is not whether momentum is rising or falling in isolation, but what that observation means alongside price location, market structure, volume or flow information, and the wider timeframe.
Why sideways markets make momentum harder to interpret
Momentum tools are generally used to assess the pace and direction of price movement. When price is trending, a sustained reading in one direction may support the idea that the current move has participation behind it. A sideways market is different. Buyers and sellers may repeatedly take control for short periods, while neither side creates enough follow-through to establish a durable trend.
This creates several misleading-looking observations. Momentum may turn upward while price is still below a range midpoint. It may fall while price is approaching support. A short-lived surge can appear at the same time as a false breakout. None of these observations automatically identifies a valid trade. They describe a condition that needs context.
Momentum is a condition, not a complete conclusion
A changing momentum reading can tell you that the balance of recent price movement has changed. It does not, by itself, explain whether the change will continue, where price is located within the range, or whether a meaningful level has been broken. Treating every momentum shift as a buy or sell instruction can lead to repeated decisions inside market noise.
For stock trend analysis, the distinction is especially useful. A trader can record that momentum improved without concluding that a new uptrend has begun. This keeps the indicator in its proper role: one input in a structured review rather than a standalone decision-maker.
Start by defining the sideways structure
Before reviewing momentum, identify the price structure that you are analysing. A range may have relatively clear upper and lower boundaries, or it may be a less orderly consolidation with overlapping candles and several failed directional moves. The quality of the boundaries matters because a momentum reading near a well-defined level has a different meaning from the same reading in the middle of an unclear formation.
Mark the most relevant recent swing areas and ask whether price has respected them more than once. You do not need to assume that every turning point is precise. The purpose is to establish a working map of where buyers and sellers have previously responded.
| Price location | What momentum may show | Useful review question |
|---|---|---|
| Near the lower range boundary | Momentum may improve after selling pressure slows | Is price reacting from support, or merely making a temporary bounce? |
| Near the upper range boundary | Momentum may weaken as buying pressure fades | Is there evidence of rejection, or is price preparing to break higher? |
| Near the range midpoint | Momentum may change frequently | Is there enough room for a meaningful move before the next boundary? |
| Just outside the range | Momentum may expand during a possible breakout | Has price shown acceptance outside the range, or only a brief excursion? |
Use price location before momentum direction
Price location provides the first layer of context. If momentum rises near the lower edge of a range, it may indicate that selling pressure is losing strength or that buyers are responding to a known area. That is worth recording, but it remains different from evidence of a sustained trend. The range ceiling may still limit the move.
Likewise, falling momentum near the upper boundary may be consistent with a rejection, but it does not guarantee that price will travel to the lower boundary. Price can pause, form another short consolidation, or break through the ceiling. A careful review therefore asks what the indicator is showing and what price would need to do next to confirm the interpretation.
Why the range midpoint often produces poor signals
The middle of a sideways structure frequently offers the least useful location for a directional conclusion. There may be limited room to either boundary, and the market can change direction before a move develops. Momentum shifts in this area can be valid observations while still offering weak context for a directional decision.
When the reading changes near the midpoint, consider labelling the market as uncertain rather than forcing a bullish or bearish interpretation. Waiting for price to approach a boundary, establish clearer structure, or show acceptance beyond a level can make the next review more informative.
Separate momentum change from momentum confirmation
A momentum change is an initial observation: the indicator has moved from stronger to weaker conditions, or from weaker to stronger conditions. Confirmation requires additional evidence. In a range, that evidence might include a reaction from a boundary, a break of a recent swing, or sustained price action beyond a meaningful level.
The exact confirmation process depends on a trader’s method. The important principle is consistency. Define in advance what would make a momentum observation more credible and what would invalidate it. This prevents a changing indicator from being interpreted differently after every candle.
A practical review sequence
- Describe the structure. Decide whether price is trending, ranging, or transitioning between the two.
- Locate current price. Note whether price is near support, resistance, the midpoint, or outside the recent range.
- Record the momentum observation. Describe whether momentum is strengthening, weakening, or oscillating without assigning a trade label.
- Check price behaviour. Look for rejection, follow-through, a break of structure, or continued overlap.
- Compare a wider timeframe. Determine whether the local range is part of a larger trend, consolidation, or reversal area.
- Define what would change the view. Identify the price action that would support, weaken, or invalidate the current interpretation.
Combine momentum with market structure
Market structure helps answer questions that momentum alone cannot. It shows whether recent highs and lows are expanding, contracting, or remaining inside a defined area. In a sideways market, repeated failures to create a new meaningful high or low may be more informative than one temporary momentum spike.
A market structure indicator can support this review by helping organise swings and potential structural changes. It should not be treated as a replacement for reading the chart. The value comes from comparing the structure shown by price with the momentum observation. For example, improving momentum paired with a higher low may deserve closer attention, while improving momentum with no meaningful change in structure may simply reflect a short bounce within the range.
Look for agreement, not perfect alignment
Indicators and price will not always change at the same time. A momentum reading may improve before a structural break, or price may test a level before momentum responds. Rather than requiring every input to agree immediately, assess whether the evidence is becoming more coherent.
Agreement can include several modest clues: price holds a boundary, a recent swing is exceeded, momentum does not quickly reverse, and the wider timeframe is not strongly opposed. This is still not a guarantee of continuation. It is simply a stronger analytical description than momentum alone.

Consider institutional and smart money observations carefully
Some TradingView tools combine momentum with trend analysis, market structure, institutional activity, or smart money concepts. These additional observations can help a trader build a broader market review, especially when a single momentum reading is ambiguous. They should still be interpreted as information about market conditions rather than proof of what price must do next.
For example, a smart money indicator may highlight activity or conditions that deserve attention near a range boundary. The appropriate response is to examine how price behaves around that area, whether the range remains intact, and whether the observation is supported across the selected timeframe. It is not appropriate to treat one highlighted condition as a guaranteed entry, exit, or outcome.
Use more than one timeframe without creating confusion
Sideways price action often looks different depending on the chart timeframe. A short-term chart may show several momentum swings inside a range that appears as a single consolidation on a wider chart. This is why multi-timeframe trend assessment can be useful during stock trend analysis.
Start with a wider timeframe to establish the broader setting. Then use the working timeframe to study the range and momentum behaviour. If a lower timeframe reading conflicts with the wider structure, describe the conflict clearly instead of automatically giving the lower timeframe priority.
| Timeframe role | Question to ask | Common mistake |
|---|---|---|
| Wider timeframe | Is the market broadly trending, ranging, or transitioning? | Ignoring the larger structure because a short-term reading changed. |
| Working timeframe | Where are the current range boundaries and swing points? | Calling every internal movement a new trend. |
| Lower timeframe | Is there short-term follow-through or rejection? | Using small fluctuations as decisive confirmation. |
Build a review checklist for a momentum indicator for TradingView
A repeatable checklist can reduce emotional interpretation. It also makes it easier to compare several chart reviews because each one uses the same questions. The checklist should be simple enough to complete before making a conclusion about market conditions.
- What type of market is visible: trend, range, or transition?
- Where is price relative to the nearest meaningful boundary?
- Is momentum strengthening, weakening, or changing repeatedly?
- Has price created a structural change, or is it still overlapping?
- Does the wider timeframe support the local observation?
- Is there evidence of rejection or acceptance at the relevant level?
- What observation would show that the current interpretation is no longer valid?
Writing the answers in neutral language is helpful. “Momentum improved while price held the lower part of the range” is more precise than “this is bullish.” The first statement can be reviewed as new information appears; the second may encourage premature commitment.
Common mistakes when reading momentum in a range
Reacting to every crossover or colour change
Visual changes are easy to notice, but they may occur frequently during consolidation. If every change receives the same importance, the analysis becomes noisy. Give greater weight to changes that occur near meaningful structure and are followed by sustained price behaviour.
Assuming divergence guarantees a reversal
A difference between price movement and momentum can be worth investigating, but it does not guarantee that price will reverse. Markets can remain in a range longer than expected, and momentum can diverge while price continues in the same direction. Treat divergence as a prompt for further review rather than a standalone conclusion.
Ignoring failed breakouts
A brief move outside a range can cause momentum to expand even when price later returns inside the structure. Review whether price remains outside the boundary and builds acceptance there. If it quickly returns to the range, the event may represent a failed breakout rather than a confirmed trend transition.
Using too many indicators to remove uncertainty
Adding more tools does not automatically produce better analysis. Several indicators may measure similar aspects of price and create the appearance of agreement without adding independent information. A smaller group of clearly understood observations is often easier to review than a crowded chart.
How an integrated TradingView indicator can support the process
An integrated tool such as the AKMelytics – Market Intelligence Indicator can be considered within this type of review when a trader wants to examine momentum alongside other market observations. The supplied feature set includes areas related to trend analysis, momentum, market structure, institutional flow, multi-timeframe assessment, and smart money analysis.
The practical benefit of an integrated view is organisation. Instead of treating a momentum change as the entire analysis, a trader can ask how it relates to trend context, structure, and other displayed conditions. The tool remains an aid for educational and trading-decision review, not financial advice and not a promise of a particular market result.
Document observations before making a conclusion
A short journal entry can reveal whether a momentum indicator is being interpreted consistently. Record the market state, price location, momentum direction, structural condition, timeframe, and what happened afterward. The purpose is not to create a guaranteed prediction model. It is to test whether your own process distinguishes a useful observation from a rushed conclusion.
Over time, this record may show that some momentum changes are more meaningful near specific structural conditions, while others occur repeatedly in the middle of a range. That distinction can improve chart reading without requiring the indicator to provide certainty.
Final perspective
When price moves sideways, a momentum indicator for TradingView is best reviewed as part of a wider market-context process. Momentum can reveal a change in the pace of price movement, but it cannot independently establish a trend, confirm a breakout, or determine what price will do next. Start with the range, locate price within it, compare momentum with market structure, check the wider timeframe, and define what would count as confirmation.
This approach keeps weak or changing momentum in perspective. It also creates a more disciplined way to use trading indicators, including tools that combine momentum with trend, structure, institutional flow, and smart money observations.
Frequently asked questions
What does a momentum indicator show in a sideways market?
It shows changes in the pace or direction of recent price movement. In a range, those changes may be temporary and should be interpreted alongside price location and market structure.
Is rising momentum a buy signal when price is ranging?
Not by itself. Rising momentum near support may deserve attention, but the range boundary, follow-through, wider timeframe, and structural behaviour also need review.
Why does momentum change so often in a consolidation?
Sideways markets contain repeated short-term shifts between buying and selling pressure. Because neither side consistently controls the market, momentum can reverse before a directional move develops.
How can market structure improve momentum analysis?
Market structure shows whether price is creating meaningful new highs or lows, respecting a range, or beginning to transition. This helps distinguish a brief momentum change from a broader structural development.
Should I use multiple timeframes with a TradingView momentum indicator?
Multiple timeframes can provide context, with a wider timeframe describing the broader market and a working timeframe showing the local range. Avoid allowing a small lower-timeframe fluctuation to override clear wider structure.
Can a smart money indicator confirm a trade in a sideways market?
A smart money indicator can organise observations related to market conditions, but it cannot guarantee a trade outcome. Any highlighted condition should be reviewed with price behaviour, structure, and risk awareness.
What is the main mistake when reading momentum during a range?
The main mistake is treating a changing or weak momentum reading as a complete trading conclusion. It is better used as one observation within a structured analysis process.


Recent Comments