
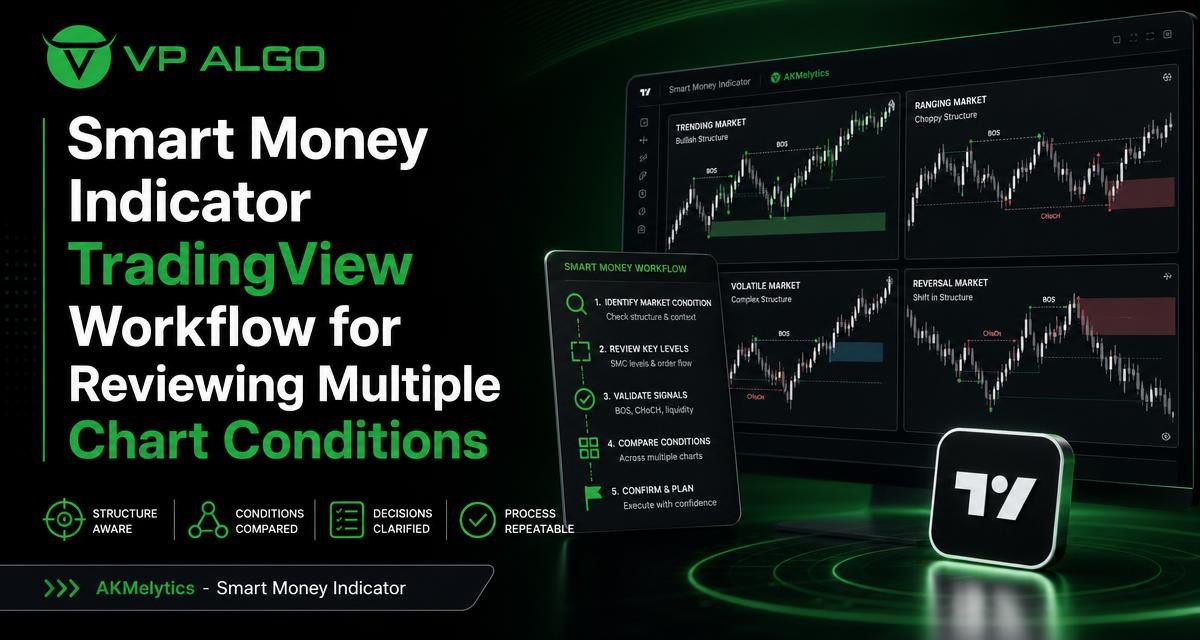
A smart money indicator for TradingView can be most useful when it is reviewed as part of a repeatable process, not treated as a reason to act on one isolated signal. By examining trend, momentum, market structure, market flow and multi-timeframe context together, traders can assess whether a potential setup fits the broader chart condition.
Why a repeatable workflow matters
Technical indicators can display a large amount of information in a short space. That information may include trend direction, momentum changes, breaks in structure, shifts in market flow, relative strength and potential target or risk reference levels. Without a defined review order, it is easy to focus on the most noticeable symbol or alert while overlooking the condition that gives it meaning.
A workflow creates a consistent way to ask the same questions on different charts. Instead of asking whether an indicator is “right” on one example, you can examine how its readings behave during directional movement, consolidation, reversals and higher-volatility periods. This approach is useful for both newer traders building chart-reading habits and experienced participants refining an existing analysis process.
What the AKMelytics Smart Money Indicator brings together
AKMelytics – Smart Money Indicator is a TradingView technical analysis tool developed and sold by VP ALGO TRADING. Its features combine several areas that traders may otherwise review separately, including momentum, trend analysis, market structure, market flow, relative strength and smart money concepts.
The indicator also includes multi-timeframe analysis, break of structure and change of character events, Fibonacci projections, volatility-based target and risk reference levels, dashboard context and configurable TradingView alerts. These features are designed to support analysis of potential trading setups and decision-making. They do not remove the need for independent review, risk awareness or a trading plan.
A five-stage TradingView review process
The following process is intended as a practical framework for assessing chart conditions. It is not a signal checklist that guarantees a trading outcome. Its purpose is to make the review more deliberate and easier to repeat.
1. Start with the higher-timeframe context
Begin with a broader chart view before studying a possible entry area. The first question is whether the market is showing a generally rising structure, falling structure or a less directional condition. A higher-timeframe view can provide context for shorter-term movements that might otherwise appear more significant than they are.
Use the multi-timeframe information to compare the broader trend with the timeframe on which you are reviewing a setup. Agreement between timeframes may make the chart easier to interpret, while disagreement is a reason to slow down and define which condition matters most to your process. A lower-timeframe shift does not automatically change the broader market structure.
2. Examine market structure
Next, review the sequence of highs, lows and structural events. A market structure indicator can help organise this information by highlighting events such as a break of structure, commonly abbreviated as BOS, or a change of character, commonly abbreviated as CHoCH.
These labels should be treated as chart context rather than automatic instructions. A structural break may be more meaningful when it occurs in a broader directional environment and is supported by other observations. A change of character can identify a possible shift in behaviour, but it still needs to be assessed against the surrounding price action, momentum and timeframe context.
3. Check momentum and relative strength
Trend information describes direction, while momentum helps you consider the strength or persistence of movement. Review whether momentum is supporting the current structure, weakening as price extends, or shifting in the opposite direction.
Relative strength can add another perspective to this review. It may help you compare the current movement with the conditions shown elsewhere in the chart or indicator dashboard, depending on how you configure and interpret the tool. Momentum and strength readings should not be isolated from structure. A strong move can still be extended, and a weak move can still remain part of a larger trend.
4. Review market flow and smart money conditions
Market flow and smart money concepts are intended to add context around how a move may be developing. Rather than looking for a single “smart money” signal, review whether the flow-related information is consistent with the trend, structure and momentum observations already made.
This stage is particularly useful when a chart presents mixed evidence. For example, price may still be moving in a broader direction while short-term momentum fades and structure begins to change. The purpose of reviewing the additional context is not to force a conclusion, but to identify whether the setup is aligned, transitional or unclear.
5. Define reference levels and an invalidation point
Once the chart context has been reviewed, consider the levels that would make the idea easier to monitor. AKMelytics includes Fibonacci projections and volatility-based target and risk reference levels. These can help organise a plan for observing a potential setup, provided they are treated as reference points rather than promises about where price will travel.
A useful review should also identify what would weaken or invalidate the original interpretation. That may involve a failure to hold a structural area, a change in the higher-timeframe context or a momentum condition that no longer supports the idea. Defining this before acting can reduce the temptation to reinterpret every new candle in favour of the original view.
How to review different chart conditions
An indicator should be assessed across more than one clean-looking example. Different conditions reveal different strengths and limitations in a workflow. The table below provides a practical way to frame the review.
| Chart condition | What to review | Useful question |
|---|---|---|
| Directional trend | Higher-timeframe trend, structure events, momentum and flow alignment | Are the shorter-term readings consistent with the broader direction? |
| Range or consolidation | Repeated structure changes, weakening momentum and nearby reference levels | Is the chart showing a clear transition, or simply movement inside a range? |
| Potential reversal | Change of character, momentum shift, relative strength and follow-through | Has the possible reversal developed enough evidence to be monitored? |
| Volatile movement | Volatility-based levels, candle behaviour, structure and timeframe agreement | Are the reference levels still practical for the current market condition? |
| Conflicting timeframes | Higher-timeframe direction compared with lower-timeframe signals | Which timeframe is guiding the process, and what would resolve the conflict? |
Using the workflow in a directional trend
In a directional market, start by identifying whether the higher-timeframe structure supports the apparent trend. Then check whether the lower-timeframe movement is continuing that structure or showing a temporary pullback. Momentum and market flow can help describe whether the movement appears supported or is losing strength.
The main risk in this condition is assuming that every continuation signal has the same quality. A trend can contain pauses, retracements and periods of weakening momentum. A structured review helps distinguish a possible continuation from a late move that needs more confirmation or simply warrants observation.
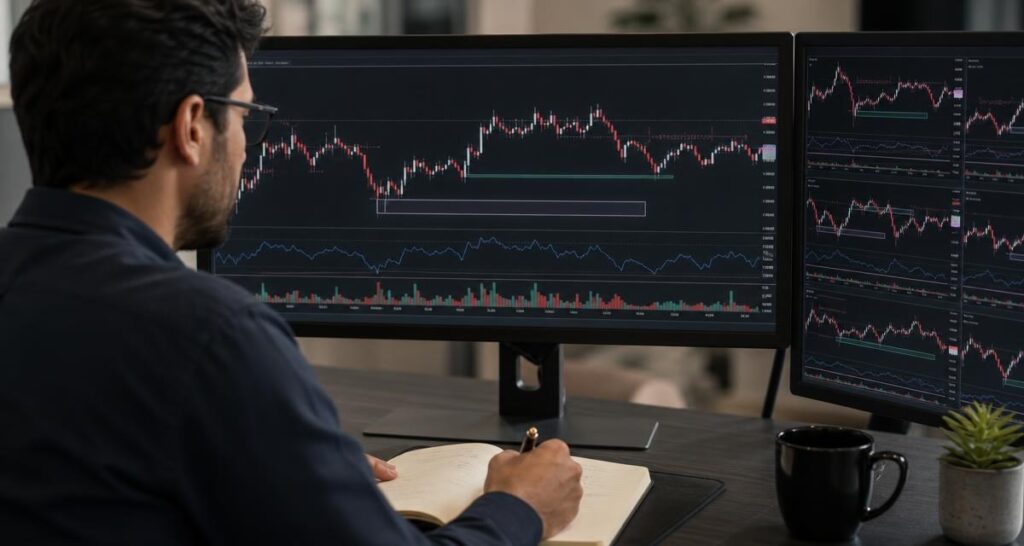
Using the workflow in a range or consolidation
Consolidation can produce frequent changes in short-term structure without establishing a sustained direction. This is a useful test for any smart money trading indicator because it shows whether the user can separate a local event from a broader change in market behaviour.
When reviewing a range, pay attention to repeated BOS or CHoCH events, the location of price relative to the range and whether momentum is actually expanding. If the higher-timeframe context remains neutral and the readings continue to conflict, the correct outcome of the workflow may be to classify the chart as unclear rather than force a directional view.
Using the workflow during a possible reversal
Reversals require patience because the first sign of weakness is not always a completed change in direction. A possible reversal review can begin with a change of character or a momentum shift, but it should continue by examining whether structure develops in the new direction.
Multi-timeframe analysis is especially relevant here. A lower-timeframe reversal may represent a temporary correction within the higher-timeframe trend. Reviewing structure, flow and relative strength together can help you describe the situation more precisely: early transition, confirmed continuation of the old direction, or unresolved conflict.
Using alerts without replacing chart review
Configurable TradingView alerts can help bring attention to events that match the conditions you want to monitor. Alerts may be useful for structural events, indicator changes or other configured observations, but an alert is not the same as a complete analysis.
Before relying on alerts, define what you will review when one appears. A practical alert response might include checking the higher timeframe, confirming the current structure, reviewing momentum and deciding whether the event fits your written rules. This prevents the notification itself from becoming the reason for a decision.
How to assess whether the indicator fits your process
The right question is not simply whether the indicator shows attractive signals. The more useful question is whether its information can be applied consistently across the charts and conditions you actually review. A tool may fit one workflow and be unsuitable for another if its displays, timeframes or level references do not match the user’s method.
Consider the following assessment points:
- Clarity: Can you explain what each relevant panel, label or level represents?
- Repeatability: Can you follow the same review order on several different charts?
- Context: Does the tool encourage you to consider trend, structure, momentum and flow together?
- Timeframe use: Can you distinguish broader context from shorter-term movement?
- Practical monitoring: Can alerts and reference levels support your existing process without replacing it?
- Discipline: Does the workflow make it easier to identify uncertainty and invalidation?
Writing down observations from different market conditions can make this assessment more objective. You might record the chart condition, the higher-timeframe context, the structural event, the momentum reading, the flow-related context and what happened after the observation. The purpose is not to create a performance claim, but to understand how the tool fits your own analysis routine.
Common mistakes when reviewing smart money indicators
Relying on one label
A single BOS, CHoCH, momentum change or dashboard reading can attract attention, but it does not describe the entire chart. Use labels as prompts for investigation rather than treating them as independent decisions.
Ignoring the higher timeframe
Shorter-term signals can appear to reverse the market while the broader structure remains unchanged. Multi-timeframe analysis helps put these movements in context and can reduce overreaction to isolated chart events.
Confusing reference levels with predictions
Fibonacci projections and volatility-based target or risk levels can organise a review. They should not be interpreted as guaranteed destinations or as a substitute for defining how much uncertainty you are prepared to accept.
Changing the rules after the fact
If the review process changes every time the chart moves against an idea, it becomes difficult to evaluate whether the process is consistent. Define the main questions and invalidation conditions before drawing a conclusion.
Getting started with the AKMelytics Smart Money Indicator
VP ALGO TRADING offers the AKMelytics – Smart Money Indicator for TradingView. The product is intended to support technical analysis and trading-decision assistance, not to provide financial advice or guarantee results.
The company offers a request-based seven-day free trial for its indicator and Telegram channel. After purchase, customers are instructed to provide their TradingView ID by email for product access. Support is available for installation, activation or usage assistance according to the company’s stated process. Review the current product information and access requirements before deciding whether the tool fits your workflow.
Final checklist for a consistent chart review
Before treating a chart as a potential setup, work through the following sequence:
- Identify the broader trend or classify the market as unclear.
- Compare the higher-timeframe context with the working timeframe.
- Review BOS, CHoCH and other relevant market structure events.
- Check whether momentum and relative strength support or challenge the structure.
- Consider market flow and smart money context without relying on one label.
- Mark useful projection, target and risk reference levels.
- Define what would weaken or invalidate the interpretation.
- Decide whether the chart fits your written process or should remain under observation.
This workflow turns a TradingView indicator from a collection of visual signals into a structured review aid. The more consistently you apply it across trends, ranges, reversals, volatility and conflicting timeframes, the clearer your understanding can become of where the tool supports your analysis and where independent judgment remains necessary.
Frequently asked questions
What is a smart money indicator for TradingView?
It is a TradingView analysis tool that presents information related to smart money concepts and may combine it with trend, momentum, market structure, flow and other chart context. It should support analysis rather than be treated as a guarantee of a trading outcome.
How does a market structure indicator help with chart review?
A market structure indicator can help organise price-action events such as breaks of structure and changes of character. These events provide context for reviewing whether market behaviour is continuing, changing or remaining uncertain.
Should I use one timeframe or several?
A multi-timeframe review can provide broader context for a shorter-term chart. The important point is to define which timeframe guides your process and how you will handle disagreement between timeframes.
Can the indicator identify profitable trades?
No indicator can guarantee profitable trades or eliminate losses. AKMelytics is designed to support technical analysis and trading decisions, while the user remains responsible for evaluating risk, context and suitability.
What should I review after receiving a TradingView alert?
Check the higher-timeframe trend, current market structure, momentum, flow context and any relevant reference levels. An alert should prompt a review rather than automatically determine an action.
Is the AKMelytics Smart Money Indicator suitable for beginners?
It may help beginners organise several areas of chart analysis, but users still need to understand the displayed concepts and develop a consistent process. Installation, activation and usage assistance can be requested through the company’s support process.


Recent Comments