
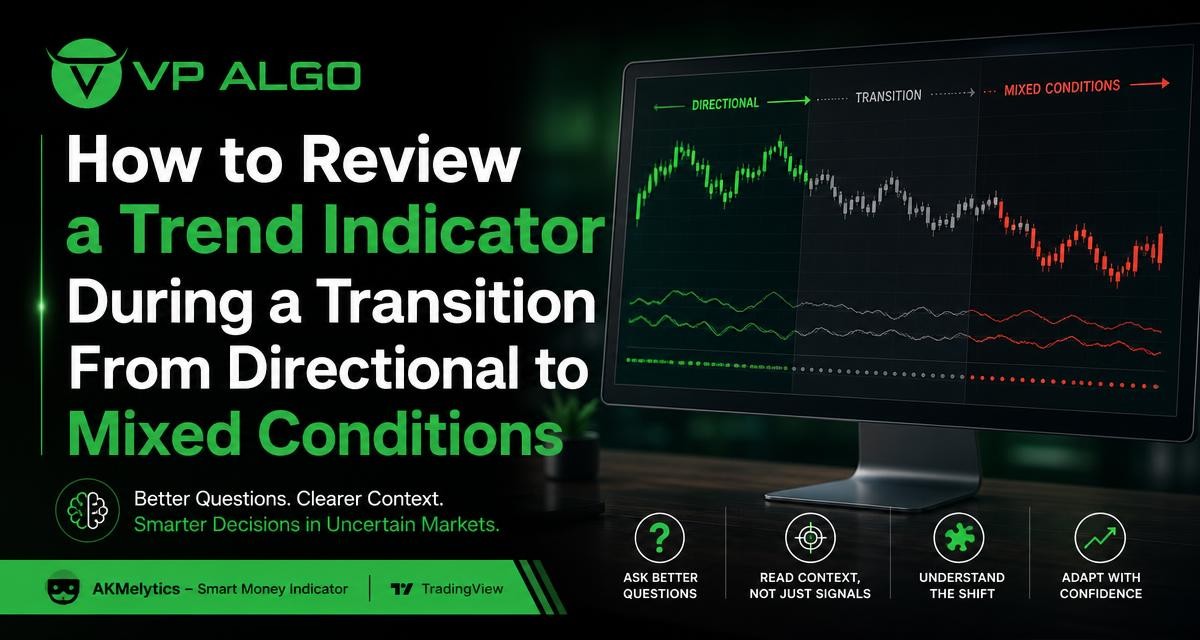
A trend indicator for TradingView can be most useful when it helps you recognize that market conditions are changing, not only when it points in one clear direction. A strong bullish or bearish reading may become less consistent as momentum fades, structure is tested, and price begins moving between competing areas. Reviewing the indicator during this transition requires a different set of questions: Is the trend actually weakening, or is the chart simply pausing? Are lower-timeframe signals conflicting with the broader structure? What evidence would confirm that the market has entered a mixed phase?
Why directional-to-mixed transitions require a different review
Directional markets often produce relatively clear sequences. Price may form higher highs and higher lows in an advancing market, or lower highs and lower lows in a declining one. A trend tool can summarize that movement through trend readings, momentum conditions, structure events, or alerts. However, a directional reading is not a permanent market state. As participation changes, price can slow down, retrace more deeply, or move sideways while different timeframes point in different directions.
A mixed condition does not automatically mean that the market is about to reverse. It means the available evidence is less aligned than before. Buyers and sellers may both be active, and a single signal may not provide enough context for a decision. The review should therefore shift from asking, “Is the trend bullish or bearish?” to asking, “Which parts of the trend are still valid, which parts are weakening, and what would change the interpretation?”
Start by separating trend direction from trend strength
Direction and strength are related, but they are not identical. Price can remain above a prior structural level while momentum weakens. Likewise, a market can experience a sharp short-term move inside a broader declining structure. If the indicator presents trend and momentum as separate areas of analysis, review them independently before combining them into a conclusion.
For example, a bullish trend reading with weaker momentum may describe a market that is still structurally supported but no longer moving with the same force. A bearish trend reading with a short-term momentum improvement may represent a countertrend bounce rather than a confirmed change in direction. Neither interpretation is sufficient by itself; both need to be compared with swing structure, timeframe context, and the location of current price.
| Review area | Question to ask | What a mixed reading may suggest |
|---|---|---|
| Trend direction | Is the broader sequence still making directional progress? | The trend may remain intact, but its continuation is less clear. |
| Momentum | Is movement supporting or contradicting the trend reading? | Participation may be slowing or shifting between buyers and sellers. |
| Market structure | Have important swing levels been defended or broken? | The chart may be transitioning, ranging, or testing a previous structure. |
| Volatility | Are price swings expanding, contracting, or becoming irregular? | Signals may need more context because movement is less consistent. |
| Timeframe alignment | Do higher and lower timeframes tell a similar story? | Short-term setups may be moving against the broader condition. |
Check whether the market structure has actually changed
When a directional reading loses consistency, market structure is one of the first areas to review. A temporary pullback is not necessarily a structural reversal. The more useful question is whether price has violated a level that previously supported the trend and whether subsequent movement confirms or rejects that violation.
A market structure indicator can help organize this review through events such as a break of structure, often abbreviated as BOS, or a change of character, often abbreviated as CHoCH. These labels should be treated as points for investigation rather than automatic trade instructions. Review the swing points behind the event, the timeframe on which it occurred, and whether price followed through after the break.
Questions for a structure review
- Which swing high or swing low defined the previous directional leg?
- Did price break that level with meaningful follow-through, or only probe beyond it?
- Has the market created a new sequence of highs and lows?
- Is the structure event visible on the higher timeframe or only on a lower one?
- Did the break occur near a major area of previous support, resistance, or consolidation?
If a structure level is briefly crossed and price quickly returns to the prior range, the event may represent a failed break or liquidity sweep rather than a confirmed transition. That distinction matters because a trader reviewing the indicator should not treat every isolated label as proof that the whole market has changed direction.
Use multiple timeframes to identify the source of the conflict
Mixed conditions often appear because different timeframes are describing different stages of the same move. A higher timeframe may still show a broad bullish structure while an intraday chart is declining within a pullback. Alternatively, a short-term bullish reversal may develop inside a larger bearish environment. Neither timeframe is necessarily wrong; they are answering different questions.
When reviewing a trend indicator for TradingView, begin with the timeframe that defines the context for your analysis. Then compare the intermediate and lower timeframes. The purpose is not to force every chart into agreement. It is to identify whether the disagreement reflects a normal retracement, a developing range, or a more meaningful structural change.
| Timeframe role | Useful review focus |
|---|---|
| Higher timeframe | Broad structure, major directional bias, significant swing points, and the overall market phase. |
| Intermediate timeframe | Current leg, pullback quality, momentum behavior, and developing structure. |
| Lower timeframe | Short-term confirmation, local breaks, volatility, and the timing of a potential setup. |
A dashboard that includes multi-timeframe trend assessment can make this comparison easier, but it does not remove the need for interpretation. A lower-timeframe signal that conflicts with the higher timeframe should be described accurately as a lower-timeframe development. It should not automatically be upgraded to a broad reversal.
Review momentum without treating it as a standalone verdict
Momentum can change before the visible trend changes. That makes it useful during transitions, but also easy to misread. Weakening momentum may show that the current move is losing energy. It does not, on its own, establish where price will move next. Momentum can pause, recover, or remain weak while price continues in the same direction.
Compare momentum with the quality of price movement. Is each new high producing less progress? Are declines becoming sharper even though the broader trend remains positive? Are candles and swings becoming more erratic? These observations help distinguish a controlled pause from a market that is struggling to maintain directional control.
Useful momentum checks
- Compare the strength of the latest impulse with earlier impulses in the same direction.
- Look for divergence between price progress and the indicator’s momentum reading.
- Check whether momentum improvement is occurring from a meaningful structural level.
- Separate a short-lived momentum burst from sustained follow-through.
- Review momentum across more than one timeframe before drawing a broader conclusion.
A momentum indicator for TradingView is best used as part of a review process. Its reading becomes more informative when it agrees with structure and price behavior, or when its disagreement explains why a previously consistent trend signal has become less reliable.
Examine volatility and the quality of price movement
Mixed conditions are not always quiet conditions. A chart can become difficult to interpret because volatility contracts into a narrow range, or because rapid two-sided swings repeatedly invalidate short-term readings. In both cases, the same signal may have a different practical meaning than it did during a clean directional move.
Review whether price is making orderly progress or repeatedly moving through nearby levels. Volatility-based reference levels, when available, can help frame the distance of a move and the amount of room around a potential setup. They should be treated as analytical references rather than promises about where price must travel.
Also consider the location of the signal. A trend reading in the middle of a congested range may be less informative than a reading supported by a clear break and follow-through. When volatility expands after a period of compression, wait for the chart to show whether that expansion has directional acceptance or merely creates another two-sided reaction.

Look for confirmation from market flow and smart money context
Trend and momentum readings describe aspects of price behavior, while market flow and smart money analysis can add another layer of context. These concepts may help a trader ask whether movement is being supported by broader participation or whether a move is occurring in a less convincing area of the chart. They should not be treated as direct evidence of the actions or intentions of specific institutions.
When a trend indicator becomes mixed, compare its reading with available flow context, relative strength, structure events, and the position of price within the recent range. A signal that agrees across several independent areas deserves closer attention than a signal that appears in isolation. Even then, agreement does not eliminate uncertainty or trading risk.
A practical confluence checklist
- Identify the broader directional condition on the higher timeframe.
- Mark the latest meaningful swing levels and any recent BOS or CHoCH event.
- Review whether momentum supports the current leg or is fading.
- Check whether market flow, relative strength, or smart money context agrees with the price structure.
- Assess volatility and determine whether the chart is trending, consolidating, or producing irregular swings.
- Write down what evidence would confirm continuation and what evidence would invalidate the current interpretation.
Distinguish a pause, a range, and a possible reversal
One of the most useful outcomes of reviewing mixed conditions is a more precise description of the market phase. A pause usually preserves important structure while the current move loses speed. A range shows repeated movement between boundaries without sustained directional progress. A possible reversal involves a meaningful structural change followed by evidence that the new direction is being accepted.
These categories can overlap while they develop. A pause may become a range, and a range may eventually produce a reversal or continuation break. Avoid forcing an early label when the evidence is incomplete. Instead, record the conditions that would move the chart from one category to another.
| Market phase | Typical review characteristics | What to monitor next |
|---|---|---|
| Pause or pullback | Original structure remains mostly intact, but momentum is less consistent. | Whether the prior trend resumes from a defended level. |
| Range or mixed phase | Price moves between nearby boundaries and directional signals alternate. | Whether a boundary break receives follow-through. |
| Possible reversal | Important structure is broken and a new sequence begins to develop. | Whether the new direction holds after a retest or pullback. |
How to use an indicator without overreacting to every signal
A TradingView indicator can organize information, highlight structure events, and support a repeatable review. It should not replace a trading plan or become a reason to take every alert. During a mixed phase, consider reducing the weight given to isolated signals and increasing the weight given to confirmation, location, and invalidation.
Configurable alerts can help you notice events such as a structure change or a relevant trend condition. Alerts are attention tools, not decisions. When an alert appears, return to the chart and review the higher timeframe, current range, momentum, volatility, and the level that would prove the interpretation wrong.
Common review mistakes
- Calling every countertrend move a full reversal.
- Ignoring higher-timeframe structure because a lower timeframe has changed direction.
- Using multiple signals that measure similar information and treating them as independent confirmation.
- Reading an alert without checking the price location where it occurred.
- Assuming a mixed signal predicts a specific future outcome.
- Changing settings repeatedly until the chart appears to agree with a preferred view.
Where the AKMelytics Smart Money Indicator fits
The AKMelytics Smart Money Indicator for TradingView combines features related to momentum, trend analysis, market structure, market flow, relative strength, and smart money concepts. Its multi-timeframe analysis, BOS and CHoCH structure events, dashboard context, Fibonacci projections, volatility-based target and risk reference levels, and configurable alerts can support a structured review of changing conditions.
Its role is to help organize analysis of potential trading setups and decision-making, not to provide financial advice or guarantee results. A useful review still depends on the trader’s own process: defining the relevant timeframe, checking the underlying price structure, considering uncertainty, and applying appropriate risk controls. The indicator can make the questions easier to ask, but it cannot remove the need for judgment.
A repeatable process for mixed market conditions
When a directional reading begins to lose consistency, use the following sequence rather than reacting to the latest signal alone:
- Define the previous trend. Record the structure and timeframe that created the original directional reading.
- Measure the change. Note whether momentum, volatility, or market flow has weakened, strengthened, or become contradictory.
- Review structure. Identify whether a meaningful swing level has been broken and whether price followed through.
- Compare timeframes. Decide whether the conflict is a normal lower-timeframe retracement or a broader change.
- Classify the phase carefully. Use descriptions such as pause, range, or possible reversal only when supported by the chart.
- Set confirmation and invalidation conditions. Write down what would support the current view and what would make it unacceptable.
- Reassess before acting. A signal can identify a condition worth reviewing without requiring a trade.
This process creates a clearer record of why the interpretation changed. It also reduces the temptation to treat a trend indicator as a simple buy-or-sell answer during the very conditions when context matters most.
Frequently asked questions
What is a trend indicator for TradingView used for?
It is used to organize information about directional movement, momentum, structure, and related market conditions on a TradingView chart. It supports analysis but does not guarantee a particular outcome.
Does a weakening trend reading mean a reversal is starting?
No. Weakening may indicate a pause, pullback, consolidation, or possible transition. A reversal requires additional evidence, especially a meaningful structure change and follow-through.
Why can different timeframes show different trend directions?
Each timeframe measures a different portion of price movement. A lower-timeframe decline may be a pullback inside a higher-timeframe advance, while a short-term rally may occur within a broader decline.
How does a market structure indicator help during mixed conditions?
It can highlight swing levels and events such as BOS or CHoCH, giving you specific areas to investigate. These events still require context and should not be treated as automatic trade instructions.
Should momentum and trend signals always agree?
No. Disagreement can be useful because it may show that directional strength is changing. Review the disagreement alongside structure, price location, volatility, and other timeframes.
Can alerts replace chart review?
No. Alerts can draw attention to a condition, but the chart still needs to be reviewed for timeframe context, structure, market phase, and invalidation.
Is the AKMelytics Smart Money Indicator financial advice?
No. It is a TradingView analysis tool designed to support evaluation of potential setups and trading decisions. It does not provide financial advice or guarantee results.


Recent Comments