
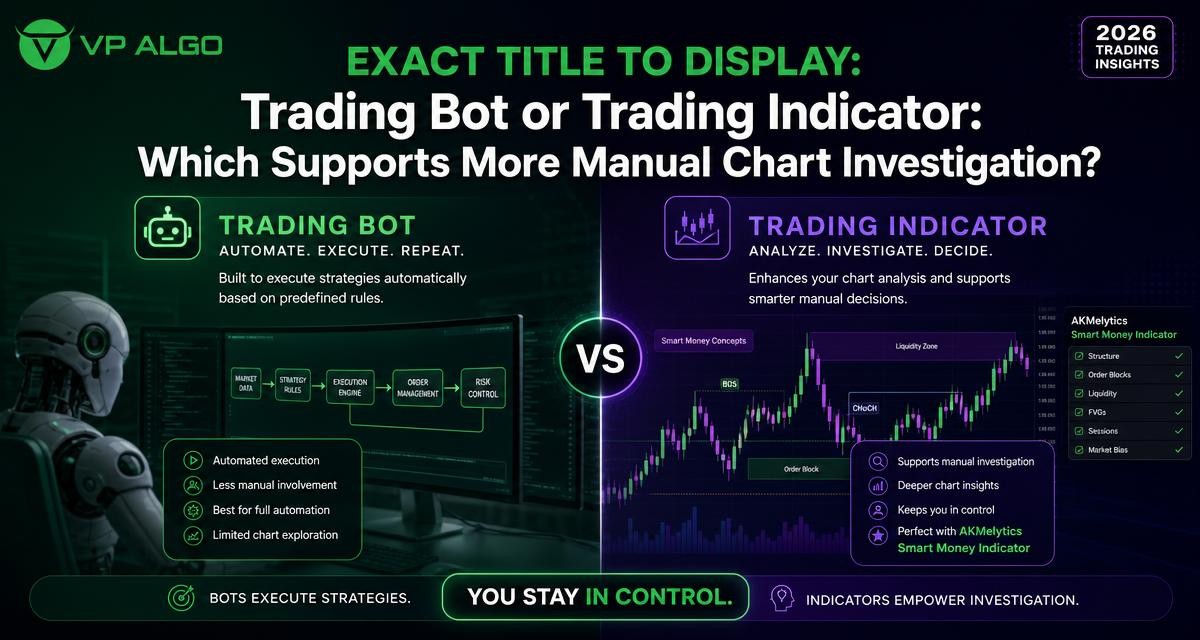
A trading bot and a TradingView trading indicator can both use algorithmic logic, but they support very different workflows. A bot is generally associated with automated execution, while an indicator helps a trader investigate price charts and make decisions directly. For traders who want to retain oversight of trend, momentum, market structure and smart money conditions, the distinction matters.
Trading bot and trading indicator: the basic difference
The clearest difference is what happens after market information is processed. A trading bot is designed around automation. Depending on its configuration and connected systems, it may evaluate defined conditions and take action without requiring the trader to inspect every chart manually. The trader’s role can shift toward configuring rules, monitoring operation and reviewing results.
A trading indicator is an analysis tool displayed on a chart. It transforms selected market data into visual elements such as lines, labels, zones, dashboards or alerts. The trader still reviews the chart, considers context and decides whether a potential setup deserves attention. This makes an indicator especially relevant to people who want structured assistance without handing over the entire decision process.
| Area | Trading bot | TradingView trading indicator |
|---|---|---|
| Primary role | Automates actions according to programmed conditions | Organises information for chart investigation |
| Trader involvement | Often focused on configuration and monitoring | Remains central to interpretation and decision-making |
| Chart oversight | May be reduced after rules are activated | Remains a direct part of the workflow |
| Best fit | Traders seeking a rules-based automated process | Traders wanting structured technical analysis support |
| Main consideration | How reliably the programmed rules reflect the intended process | How clearly the displayed information supports independent analysis |
Why manual chart investigation still matters
Manual investigation allows a trader to examine more than an isolated signal. A chart can be reviewed for the direction of the broader trend, changes in momentum, recent structural events and the relationship between multiple timeframes. These observations may influence whether a setup is considered relevant, ignored or monitored for additional confirmation.
Manual analysis does not mean working without structure. In fact, a clearly designed indicator can make the process more consistent by bringing related information into one chart view. The trader can ask the same questions repeatedly instead of relying on an unplanned visual scan or reacting to every prominent price movement.
Questions a trader may investigate manually
- Is the current market structure supporting continuation or showing a possible change?
- Does momentum agree with the apparent trend?
- What does a higher timeframe suggest about the wider context?
- Are institutional activity or smart money conditions relevant to the setup being reviewed?
- Are projected levels and risk references being interpreted as planning tools rather than guarantees?
How a trading bot changes the investigation process
A trading bot can reduce the need for continuous manual chart review by applying predetermined instructions. That may be useful for a trader whose process is highly rule-based and clearly defined. Instead of waiting for a person to notice a specific combination of conditions, software can monitor those conditions according to its programming.
However, automation does not remove the need for investigation before deployment. The trader still needs to understand what the rules measure, when they are intended to operate and what assumptions they contain. A bot can follow instructions consistently, but it cannot automatically make a vague strategy precise. It also does not turn uncertain market conditions into certain outcomes.
Where automation can be helpful
- Applying the same predefined conditions without discretionary variation.
- Reducing the need to watch charts continuously for a particular rule combination.
- Supporting a process in which entries, exits or other actions have already been defined.
- Creating a repeatable operational workflow for a trader who understands the underlying logic.
Where automation can limit manual oversight
- The trader may see less of the reasoning behind each automated action.
- Rules may not reflect unusual context that a human would consider important.
- Changing market conditions can make a previously chosen process require review.
- Technical configuration and monitoring become important parts of the workflow.
These points do not make a trading bot inherently unsuitable. They clarify the trade-off. A bot prioritises execution of programmed logic, while a chart-based indicator prioritises investigation and human interpretation.
How a TradingView trading indicator supports investigation
A TradingView trading indicator can act as an organised layer of technical analysis. Instead of requiring the trader to calculate or remember every observation separately, it can present selected information through chart elements, dashboards and alerts. The trader can then examine those elements alongside price action and decide how much weight to give them.
The AKMelytics – Smart Money Indicator is described as a TradingView technical analysis tool combining momentum, trend analysis, market structure, market flow, relative strength and smart money concepts. Its stated features include multi-timeframe analysis, BOS and CHoCH structure events, Fibonacci projections, volatility-based target and risk reference levels, dashboard context and configurable TradingView alerts. These features are intended to support analysis of potential setups and decision-making, not to provide financial advice or guarantee results.
Trend and momentum context
Trend analysis helps frame the direction a trader is investigating, while momentum can provide additional context about the strength or persistence of a move. Looking at both may be more informative than treating a single buy or sell label as a complete conclusion. A trader can consider whether the broader direction and current momentum support the same interpretation or present conflicting information.
Market structure events
Market structure tools can help organise observations about changes in price behaviour. Events such as a break of structure, commonly abbreviated as BOS, or a change of character, commonly abbreviated as CHoCH, can draw attention to a possible continuation or shift. They are reference points for investigation, not automatic proof that a future move will occur.
Multi-timeframe review
Looking at more than one timeframe can help separate broader context from shorter-term movement. A lower-timeframe setup may appear different when viewed against a higher-timeframe trend. A multi-timeframe indicator can make that comparison easier to conduct, but the trader remains responsible for interpreting whether the timeframes are relevant to the question being asked.
Which approach gives more control over chart interpretation?
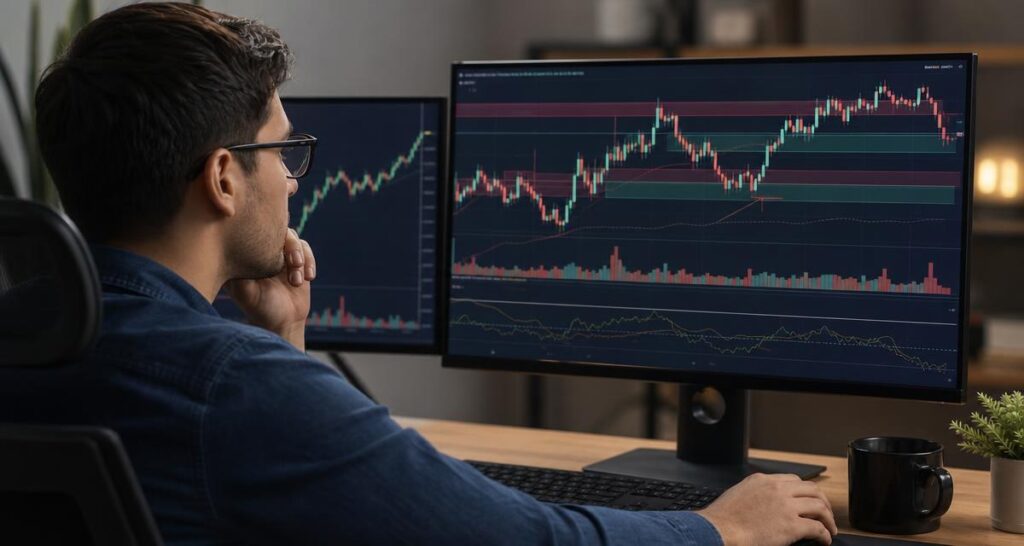
For direct manual chart investigation, an indicator generally gives the trader more visible control. The chart remains the centre of the process, and the user can inspect the conditions that led to interest in a potential setup. This is useful for beginners developing a repeatable review process as well as experienced traders refining an established method.
A bot provides a different type of control: control over programmed execution. That can be valuable when the trader has already defined a process and wants software to apply it consistently. Yet it is less suited to someone whose main objective is to compare context, question a signal and decide manually whether the evidence is sufficient.
| If your priority is… | The more natural starting point is… | Why |
|---|---|---|
| Learning how market conditions are represented on a chart | TradingView trading indicator | It keeps the investigation visible and interactive. |
| Reviewing trend, momentum and structure together | TradingView trading indicator | Multiple analytical elements can be viewed in one workflow. |
| Applying fixed rules with less manual intervention | Trading bot | Automation can carry out predefined instructions. |
| Questioning whether a setup fits the wider context | TradingView trading indicator | The trader remains involved in contextual interpretation. |
| Standardising a process after its logic is understood | Either, depending on the objective | An indicator can support review, while a bot can automate selected rules. |
Indicator-assisted analysis is not the same as automatic trading
One common source of confusion is assuming that an advanced indicator and a trading bot serve the same purpose. They do not. An indicator may use sophisticated trading algorithms to calculate conditions and present them clearly, but that does not mean it independently executes trades. Its value can lie in helping the trader notice relationships that deserve closer examination.
Likewise, an alert is not the same as an automated order. An alert can prompt the trader to review a chart at a particular moment. The trader can then assess trend, momentum, structure, market flow and other relevant context before deciding what, if anything, to do. This preserves a manual checkpoint that automated execution may bypass.
How to choose between a trading bot and an indicator
The right choice depends less on which tool sounds more advanced and more on how the trader wants to work. Start by describing the desired workflow in practical terms. Does the trader want to study charts and retain final responsibility for interpreting them, or is the main goal to automate a clearly defined process?
Choose an indicator-led workflow when you want to:
- Keep direct visibility of the chart during analysis.
- Compare trend, momentum, market structure and multi-timeframe context.
- Develop a repeatable investigation process while continuing to make the final assessment.
- Use alerts as prompts for review rather than treating them as automatic decisions.
- Learn how different forms of technical information relate to one another.
Consider a bot-led workflow when you want to:
- Apply rules that have already been defined clearly.
- Reduce the amount of continuous manual monitoring required by that process.
- Focus on implementation, configuration and oversight of automated instructions.
- Accept that the system will act according to its programming rather than personal judgement at every moment.
Some traders may use both at different stages. An indicator can support manual research and help clarify a rules-based idea. A separate automated tool may then be considered only after the trader understands the logic and accepts the responsibilities of monitoring it. Using both does not remove the need for risk awareness or ongoing review.
A practical manual investigation routine
For traders who prefer chart oversight, a consistent routine can make an indicator more useful. Begin with the wider context before focusing on a specific signal. Review the higher-timeframe trend, then examine the current timeframe for momentum and market structure. Next, consider whether the displayed conditions agree or conflict.
- Define the market question being investigated rather than scanning for any available signal.
- Review the broader trend and compare it with the shorter-term chart.
- Examine momentum and relative strength in relation to the observed move.
- Check for relevant BOS or CHoCH events and consider what they do, and do not, establish.
- Review market flow and smart money information as additional context.
- Consider projected, target or risk reference levels as planning information rather than promises.
- Record the reasoning behind the decision so the process can be reviewed later.
This routine keeps the indicator in its proper role: a decision-support and investigation aid. It also discourages the habit of treating one label, colour or alert as a complete trading plan.
Final answer: which supports more manual chart investigation?
If the question is specifically about manual chart investigation, a TradingView trading indicator is usually the more direct fit. It keeps the trader engaged with the chart and can organise several analytical perspectives without replacing human judgement. The AKMelytics – Smart Money Indicator is positioned for this type of analysis, with features covering trend, momentum, structure, market flow, relative strength, multi-timeframe context and smart money concepts.
A trading bot is better understood as an automation-focused tool. It may suit a trader who has a defined process and wants software to apply selected rules, but it changes the role of manual investigation. Neither approach guarantees a particular result, and both require the user to understand the tool, its assumptions and its limitations. For traders who want to remain directly involved in reading charts, an indicator-led workflow offers the clearer starting point.
Frequently asked questions
Is a trading bot the same as a trading indicator?
No. A trading bot is associated with applying programmed rules automatically, while a trading indicator presents information to support chart analysis. An indicator can assist decisions without executing them.
Which is better for beginners: a trading bot or an indicator?
An indicator may be a more suitable starting point for beginners who want to learn how trend, momentum and market structure appear on a chart. It keeps the investigation visible instead of hiding the process behind automated execution.
Can a TradingView trading indicator replace manual analysis?
It can organise and simplify parts of analysis, but it should not be treated as a replacement for understanding market context. The trader still needs to interpret the displayed information and decide how it fits the intended process.
Do alerts from an indicator automatically place trades?
Not necessarily. An alert can notify a trader that a selected condition has appeared. Whether any action follows depends on the trader’s workflow and the tools connected to it.
What does the AKMelytics – Smart Money Indicator analyse?
Its described features cover momentum, trend analysis, market structure, market flow, relative strength, smart money concepts and multi-timeframe context. It also includes structure events, Fibonacci projections, reference levels, dashboard information and configurable alerts.
Does an indicator guarantee profitable trading results?
No. An indicator is an analysis and decision-support tool. It cannot guarantee profits, eliminate losses or predict future market outcomes.


Recent Comments