
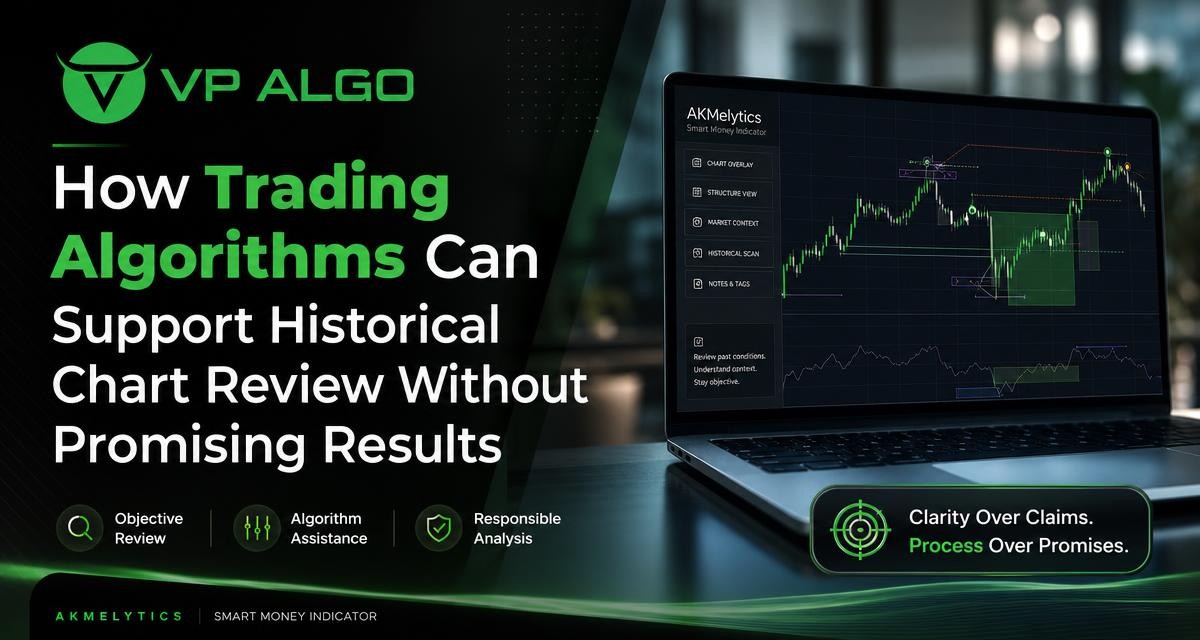
Trading algorithms can help traders review historical charts in a more structured way, especially when several factors need to be considered at once. Used responsibly, algorithm-assisted tools can organize observations about trend, momentum, market structure, institutional activity and smart money conditions. They cannot turn historical patterns into certainty, guarantee a future outcome or replace careful judgment.
What historical chart review is designed to examine
Historical chart review involves looking back at completed or developing market conditions to understand how different signals appeared in context. The purpose is not simply to find examples that appear to confirm a preferred trading idea. A useful review asks what the market looked like before a move, which conditions were present during it and what information was available at the time.
This distinction matters because a chart can look obvious after an outcome is known. Once a strong move has already taken place, support and resistance levels, breaks of structure and momentum changes may seem easier to identify. Reviewing the sequence as it developed can provide a more disciplined view of what a trader could reasonably have observed at that point.
Questions a structured review can address
- Was the broader trend rising, falling or moving sideways?
- Did momentum support the direction of the move, or was it weakening?
- Did price create a meaningful break of structure or a change in character?
- Were multiple timeframes broadly aligned or in conflict?
- Did the chart show a possible setup, or only one isolated signal?
- What information was visible before the outcome rather than after it?
Where trading algorithms can assist
Trading algorithms used inside charting tools can apply defined calculations and display selected conditions consistently. Instead of manually scanning every candle for several types of information, a trader may use an indicator to bring related observations into one review process. This can make chart study more repeatable, although it does not make the underlying interpretation infallible.
For example, the AKMelytics – Smart Money Indicator is designed for TradingView and combines features related to momentum, trend analysis, market structure, market flow, relative strength and smart money concepts. Its role is to support the evaluation of potential trading setups and market context, not to provide financial advice or promise a particular result.
Turning several chart inputs into one review framework
Historical analysis often becomes difficult when a trader jumps between unrelated tools. A trend indicator may describe direction, while a momentum indicator provides information about strength and a market structure indicator identifies events such as a break of structure or change of character. Reviewing these elements together can help the trader record why a chart appeared notable.
The value is primarily organizational. A tool can help make the review process less dependent on memory or on selectively noticing one attractive feature. It still remains the trader’s responsibility to decide which conditions are relevant, how much weight to give them and whether the review method has limitations.
Key features to examine during historical chart review
Trend and multi-timeframe context
Trend analysis provides a starting point for understanding whether price has been making broadly higher, lower or less directional movements. Looking at more than one timeframe can add context: a shorter chart may show a pullback while a higher timeframe still reflects a broader trend, or a short-term breakout may occur within a wider range.
Multi-timeframe analysis should not be treated as proof that one direction must continue. Instead, it can help separate local movement from broader context. During a historical review, record the timeframe used, the apparent direction and whether the different views supported each other or presented conflicting information.
Momentum and relative strength
Momentum analysis focuses on the pace and persistence of movement. Strong price movement and weakening momentum may tell different stories, while a market that is moving slowly may require a different interpretation from one showing rapid expansion. Relative strength can also be useful as a contextual input, but it should not be treated as a standalone prediction.
When reviewing past charts, note whether momentum was increasing, declining or mixed before the relevant price event. This helps avoid describing every historical move as if it had the same internal conditions. It also encourages the trader to examine whether momentum information added context or merely followed a move that was already visible.
Market structure events
Market structure analysis examines how price forms swings and whether those swings are being maintained or broken. Events commonly associated with this type of review include break of structure, or BOS, and change of character, or CHoCH. These labels can help traders describe an event consistently, but the labels themselves do not remove the need for interpretation.
A historical chart review should consider the size, location and surrounding conditions of a structure event. A break occurring inside a noisy range may deserve a different assessment from one that follows a sustained directional sequence. Reviewing the candles before and after the event can also help show whether the movement developed with follow-through or quickly returned to the prior range.
Smart money and market flow context
Smart money concepts and market flow analysis are often used to study how price may be behaving around liquidity, structure and areas of interest. Algorithm-assisted features can help place these observations on the chart so they can be reviewed alongside trend and momentum rather than in isolation.
These concepts should be approached as analytical frameworks, not as direct access to the intentions of every institutional participant. A chart-based indication may describe a condition or pattern according to the tool’s rules, but it does not confirm who acted, why they acted or what will happen next.
Volatility and reference levels
Volatility can change how a price movement should be interpreted. A small move may be significant in a quiet period but relatively ordinary during a highly active one. The AKMelytics – Smart Money Indicator includes volatility-based target and risk reference levels as part of its feature set. In historical review, such levels can help a trader discuss the distance and scale of a move without presenting them as guaranteed targets.
Reference levels are not the same as outcomes. They can support chart organization and scenario planning, but actual price behavior may differ. A responsible review records what the level represented at the time and whether the market respected, crossed or ignored it.

A practical process for reviewing completed charts
- Define the review question. Decide whether the review concerns trend continuation, a structure event, momentum change, a pullback or another clearly described condition.
- Choose the timeframe and review point. Mark the point at which the information would have been available. Avoid starting with the final outcome and working backward.
- Record the broader context. Note the visible trend, range conditions, volatility and relevant higher-timeframe information.
- Review the algorithm-assisted features. Examine trend, momentum, market structure, flow and smart money observations as separate inputs before forming an overall view.
- Describe the possible setup neutrally. Use language such as “the chart showed conditions that may have been worth monitoring” rather than “the signal would have worked.”
- Check what happened next. Record continuation, reversal, consolidation or uncertainty. Include examples that did not produce the preferred outcome.
- Document limitations. Note missing data, ambiguous structure, conflicting timeframes and any feature that would have required subjective interpretation.
How to reduce hindsight bias
Hindsight bias is one of the main risks in historical chart review. After a move is complete, a trader may unconsciously give more importance to signals that appeared before the move and overlook signals that were unclear, late or contradictory. This can make a method seem more reliable in review than it would have been in real time.
One practical safeguard is to use a fixed review template. Capture the chart state before examining the later candles, or use screenshots and notes that preserve the order of observation. Review a mixture of examples, including clear, mixed and unsuccessful outcomes. The aim is not to prove that a tool is always right; it is to understand how its information appears under different conditions.
| Review area | What to record | Responsible interpretation |
|---|---|---|
| Trend | Direction, range or transition across selected timeframes | Context for analysis, not a promise of continuation |
| Momentum | Strengthening, weakening or conflicting momentum | One input among several, not a standalone signal |
| Market structure | BOS, CHoCH, swing behavior and follow-through | An event to investigate rather than automatic confirmation |
| Smart money and flow | Displayed areas, conditions or changes in market flow | A chart-based framework, not proof of institutional intent |
| Volatility | Relative movement and reference levels | A way to frame scale and risk considerations |
Using alerts without treating them as instructions
Configurable TradingView alerts can help traders notice when a selected chart condition occurs. During historical review, alerts can also clarify which event the trader intended to monitor. However, an alert is only a notification based on defined conditions. It does not explain the full market context and should not automatically be treated as an instruction to buy or sell.
A careful workflow uses an alert as a prompt for further review. The trader can then assess the higher-timeframe trend, current momentum, market structure, volatility and any conflicting information. This approach keeps the alert within a decision-support process rather than presenting it as a guaranteed signal.
Common mistakes when reviewing algorithm-assisted charts
Judging a tool from selected examples
Choosing only the clearest historical examples can create an incomplete picture. A fair review should include different market conditions and examples where the chart information was mixed. Otherwise, the review may measure the quality of the examples selected rather than the usefulness of the method.
Confusing a visual label with an explanation
A label can identify a condition, but it does not necessarily explain why price moved or whether the condition will matter again. Read the label in relation to the surrounding chart, the timeframe and the broader structure.
Assuming more features means more certainty
Several aligned features may make a chart easier to describe, but agreement between indicators is not a guarantee. Some features may be derived from related price information, so apparent confirmation may not represent independent evidence.
Ignoring timing and information availability
Historical review should distinguish between information visible before an event and information that appeared only afterward. A conclusion based on the completed chart may not reflect what a trader could have known in real time.
How beginners and experienced traders can use the review differently
Beginners may benefit from using algorithm-assisted features as a checklist for learning chart vocabulary and organizing observations. Rather than trying to act on every signal, they can compare trend, momentum and structure descriptions with the candles on the chart. This encourages a process-based understanding of stock technical analysis.
More experienced traders may use the same features to audit an existing approach, compare market conditions or identify where their interpretation becomes inconsistent. The tool does not replace a trading plan. It can, however, provide a common framework for recording observations and reviewing decisions.
Keeping expectations realistic
Trading algorithms are most responsibly presented as analytical aids. They can process defined conditions, display relevant chart information and support a repeatable review routine. They cannot remove market uncertainty, guarantee profitable results or establish that a future movement will repeat a historical pattern.
VP ALGO TRADING positions its indicators for educational and trading-decision assistance purposes rather than as financial advice. Traders should evaluate any tool according to their own process, risk tolerance and understanding of its features. Historical chart review can improve discipline, but it is not proof of future performance.
Frequently asked questions
Can trading algorithms predict what will happen next?
No. Trading algorithms can identify or display defined chart conditions, but historical patterns and indicator readings do not guarantee a future market outcome.
What can the AKMelytics – Smart Money Indicator help me review?
It is designed to support review of trend, momentum, market structure, market flow, relative strength and smart money concepts on TradingView, including multi-timeframe context and selected reference features.
Is an algorithm-generated alert a buy or sell instruction?
No. An alert is a notification based on selected conditions. It should be evaluated alongside the wider chart context and a trader’s own decision process.
How can I reduce hindsight bias in chart review?
Record the chart conditions before examining the eventual outcome, use a consistent review template and include mixed as well as favorable examples.
Should one indicator be used on its own?
A trader should understand the limitations of any individual tool. Trend, momentum, structure, volatility and other observations may provide context, but none should be treated as a guarantee.
Does historical chart review prove that a strategy will work?
No. It can show how a method appeared under selected historical conditions, but it cannot establish future results or eliminate uncertainty and trading losses.


Recent Comments