
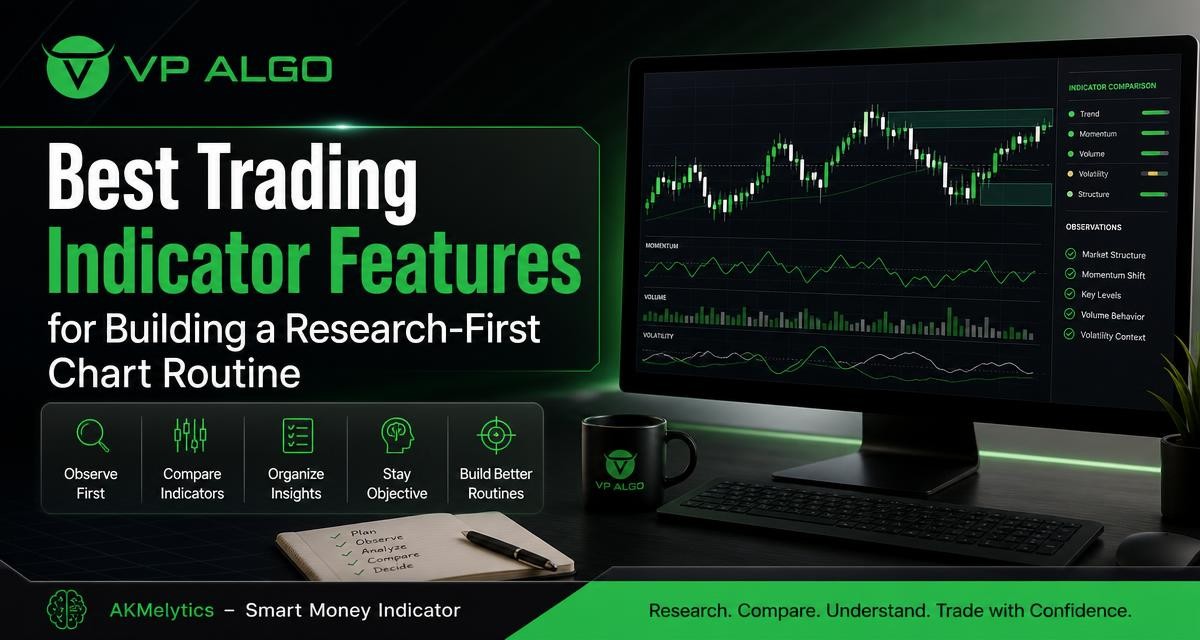
Choosing the best trading indicator is less about finding a tool that promises perfect entries and more about finding features that improve the quality of your chart research. A research-first routine uses indicators to organize observations about trend, momentum, market structure, market flow, and multiple timeframes before you make a personal trading decision.
What makes a trading indicator useful for research?
A useful trading indicator helps you answer specific questions consistently. Is the market moving in a clear direction? Is momentum supporting that move? Has market structure changed? Are there signs of stronger participation or changing flow? Can the same chart be reviewed across more than one timeframe without losing context?
These questions are different from asking an indicator to tell you exactly when to buy or sell. An indicator can process chart information and present it in an organized way, but it does not remove uncertainty. Its value comes from helping you observe conditions, record evidence, and compare a potential setup with your own rules.
| Feature | Research question | Useful role in a chart routine |
|---|---|---|
| Trend analysis | What direction is the market currently displaying? | Provides directional context before a closer review |
| Momentum evaluation | Does current movement have supporting strength? | Helps distinguish movement from a potentially weakening move |
| Market structure | Have important highs, lows, or structural events changed? | Organizes observations about continuation and possible shifts |
| Market flow and smart money concepts | What does the tool identify about participation and flow? | Adds another layer of context for setup research |
| Multi-timeframe analysis | Do conditions align across the chart timeframes being reviewed? | Reduces the risk of examining one timeframe in isolation |
| Alerts and dashboards | Can important observations be monitored and reviewed efficiently? | Supports repeatable research without replacing judgment |
Compare indicators by the questions they help you answer
Trend analysis for directional context
A trend indicator for TradingView is most useful when it gives your review a starting point. Instead of immediately searching for an entry, you can first describe whether price is showing an upward, downward, or less decisive condition according to the tool and your own chart reading.
Trend information should not be treated as a complete trading strategy. A trend display may help organize the chart, but it does not by itself explain the quality of a move, the level of risk involved, or whether the conditions fit your plan. The best trading indicator for research is one that makes this context easier to see without encouraging you to skip the rest of your process.
Momentum evaluation for movement quality
Momentum features help you examine the character of current price movement. They can support questions such as whether movement appears to be strengthening, slowing, or moving against the broader context. This is especially useful when a chart looks active but the direction is not yet clear.
A momentum indicator for TradingView should be treated as an observation tool rather than a standalone signal generator. Momentum can change, conflict with trend information, or reflect a short-term move inside a wider market structure. Recording those relationships is more useful than responding automatically to one reading.
Market structure events
Market structure features organize the relationships between significant highs and lows. The AKMelytics Smart Money Indicator description includes BOS and CHoCH structure events, which can help users mark observations about breaks of structure and changes of character on a TradingView chart.
These labels still require interpretation. A structure event should be considered alongside the timeframe, surrounding price action, momentum, and the rules of your research process. Treating every label as a complete trade instruction can create a mechanical routine that ignores context.
Why multi-timeframe context matters
A chart can look constructive on one timeframe and uncertain on another. Multi-timeframe analysis helps you separate broader context from more local movement. For example, a higher timeframe can be reviewed for general structure and trend, while a lower timeframe can be examined for more detailed movement. The exact timeframes and rules should come from your own method rather than from a universal formula.
A TradingView indicator with multi-timeframe trend assessment can make this review easier to organize. The main benefit is not that several timeframes produce certainty. It is that the information can be placed side by side, allowing you to record alignment, disagreement, and questions for further research.
- Start with the broader timeframe you normally use for context.
- Record the displayed trend and important structure observations.
- Move to the timeframe used for setup research.
- Note whether momentum and structure support or conflict with the broader view.
- Decide whether the chart deserves further review under your personal rules.
Institutional activity and smart money concepts as research layers
Smart money concepts and institutional activity features can add another interpretive layer to chart analysis. In a research-first routine, these features are best used to organize observations about market flow and potential areas of interest, not to imply that the tool can identify every institutional decision or predict what the market will do next.
A smart money indicator may be useful to traders who already want to study concepts such as structure events, flow, and participation. It can help bring related observations into one chart review, but it should remain part of a broader process. Price behavior, timeframe context, risk planning, and personal decision rules still matter.
Relative strength and flow observations
Relative strength and market-flow information can help you compare the quality of movement within the context shown by the chart. These features are most valuable when they lead to a clear written observation, such as “momentum is improving while the broader structure remains uncertain,” rather than a vague conclusion that the indicator is bullish or bearish.
Use an indicator to improve the questions you ask of a chart, not to avoid asking questions at all.
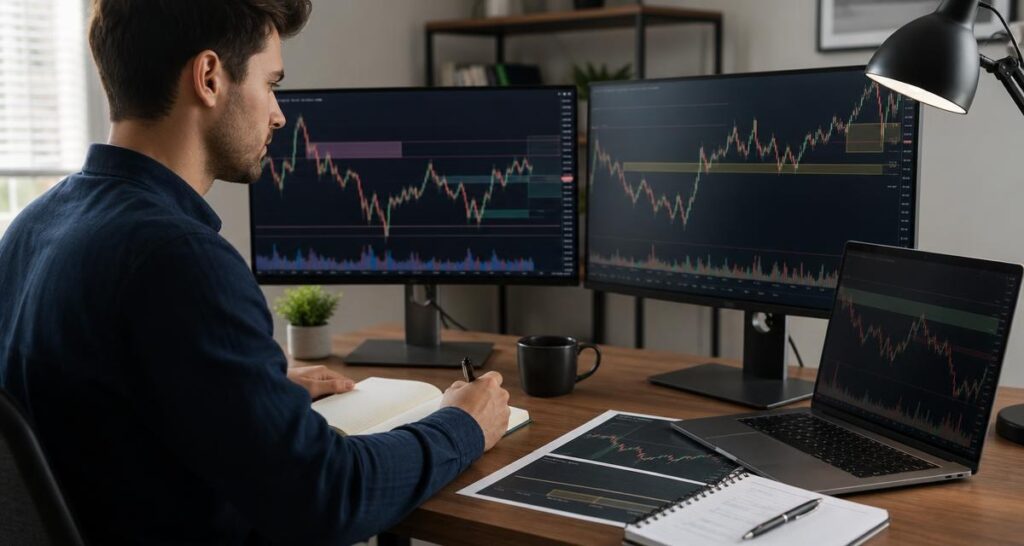
Useful features beyond basic signals
Dashboards for consistent review
A dashboard can bring trend, momentum, structure, and other readings into one view. This can reduce the need to move between several separate indicators while researching a chart. It may also make it easier to compare the same categories of information from one chart review to the next.
However, more information is not automatically better. A dashboard should support a short and repeatable checklist. If the display is crowded or every field receives equal attention, it may become harder to identify the observations that actually matter to your method.
Configurable TradingView alerts
Configurable alerts can help you monitor selected observations without watching a chart continuously. For research, an alert can mark an event that deserves later review, such as a structure change or another condition supported by the indicator.
An alert is not a substitute for analysis. Before acting on any notification, review the relevant timeframe, surrounding market conditions, and your personal decision rules. This distinction is important because an alert can draw attention to an event without explaining its significance.
Fibonacci projections and reference levels
Fibonacci projections can provide reference levels for chart study. When combined with other observations, they may help you document possible areas of interest or compare the location of price with a projected level. They should not be presented as guaranteed targets or as evidence that a particular outcome will occur.
Volatility-based target and risk references
Volatility-based target and risk reference levels can help structure a discussion about potential movement and planning. They are reference points, not promises. Market conditions can change, and the usefulness of any level depends on how it fits your timeframe, position-sizing rules, and wider risk process.
How to compare a best trading indicator with separate tools
Some traders prefer one integrated TradingView indicator, while others build a chart from several specialized tools. Neither approach is automatically superior. The relevant comparison is whether the setup helps you perform the same research steps clearly and without unnecessary duplication.
| Approach | Potential research benefit | Question to ask |
|---|---|---|
| Single integrated indicator | Places several categories of analysis in one workflow | Can I understand the display and use it consistently? |
| Several specialized indicators | Allows more individual control over each analysis layer | Are the tools adding distinct information or repeating the same signal? |
| Minimal chart setup | Keeps attention on price and a small number of observations | Does the simpler view provide enough context for my research? |
When comparing tools, look at clarity, consistency, and relevance rather than the number of signals. A chart that produces many notifications may still be less useful than one that helps you form a small number of well-defined observations.
Building a research-first chart routine
Step 1: Define the purpose of the review
Begin by stating what you are trying to learn from the chart. You may be reviewing trend direction, studying a structure change, comparing timeframes, or examining how momentum relates to market flow. A defined purpose keeps the indicator from becoming a collection of disconnected readings.
Step 2: Review context before detail
Start with the timeframe and market context that matter to your own process. Record the broad trend, notable structure events, and any disagreement between the displayed features. Only then move toward more detailed observations.
Step 3: Separate observation from interpretation
Write down what the indicator shows before deciding what it means. For example, “a CHoCH event is displayed” is an observation. “The market will reverse” is a prediction. Keeping these statements separate helps reduce overconfidence and makes later review more honest.
Step 4: Check agreement and conflict
Compare trend, momentum, structure, flow, and timeframe readings. Agreement may justify deeper research, while conflict may identify a reason to wait or investigate further. Neither outcome guarantees a result; both are useful information for a disciplined process.
Step 5: Record the decision boundary
End the review by documenting what would need to be true before you considered the chart actionable under your own rules. This could include confirmation, a defined risk reference, or a clearer relationship between timeframes. If those conditions are absent, the research can still be complete without producing a trade decision.
Where the AKMelytics Smart Money Indicator fits
The AKMelytics Smart Money Indicator is described as a TradingView technical analysis tool combining algorithmic features for momentum, trend analysis, market structure, market flow, relative strength, and smart money concepts. Its described functions also include multi-timeframe analysis, BOS and CHoCH events, Fibonacci projections, volatility-based target and risk reference levels, a dashboard, and configurable TradingView alerts.
That combination may suit traders who want to organize several research categories within one chart environment. Its role should be understood as analysis and decision-making assistance, not financial advice or a guarantee of profitable results. Traders remain responsible for interpreting the information, applying their own trading strategies, and managing risk according to their personal circumstances and rules.
Common mistakes when choosing an indicator
- Choosing by signal volume: More labels and alerts do not necessarily mean better research.
- Using one feature as a complete strategy: Trend, momentum, or structure should be considered in context.
- Ignoring timeframe differences: A short-term reading may not describe the broader chart.
- Confusing reference levels with forecasts: Projections and volatility references are not guarantees.
- Skipping documentation: Without notes, it is difficult to assess whether the tool improves your process.
- Expecting certainty: An indicator can organize information while uncertainty remains.
FAQ about choosing the best trading indicator
What is the best trading indicator for every market?
There is no single indicator that is best for every trader, chart, or research method. The better choice is the tool whose features help you evaluate the specific conditions and questions relevant to your process.
Is a smart money indicator enough to make a trading decision?
No. A smart money indicator can organize observations about structure, flow, and related concepts, but it does not replace personal analysis, risk planning, or decision rules.
Why should a trading indicator include multiple timeframes?
Multiple-timeframe features can help you compare broader context with more local movement. They are useful for identifying agreement or conflict, but they do not eliminate uncertainty.
Are TradingView alerts automatic buy and sell signals?
Alerts identify conditions configured in the indicator or chart. They should be treated as prompts for review rather than automatic instructions to buy or sell.
What should I compare when reviewing trading strategies?
Compare how each strategy uses trend, momentum, structure, timeframe context, and risk references. Also consider whether its rules are clear enough to apply and document consistently.
Can an indicator guarantee profitable results?
No. Indicators provide analytical information and cannot guarantee profits, eliminate losses, or predict future market results.
How can I test whether an indicator improves my routine?
Use a consistent review template, record the indicator observations and your reasoning, and evaluate whether the tool improves clarity and repeatability over time. Keep the assessment separate from any assumption of guaranteed performance.


Recent Comments