
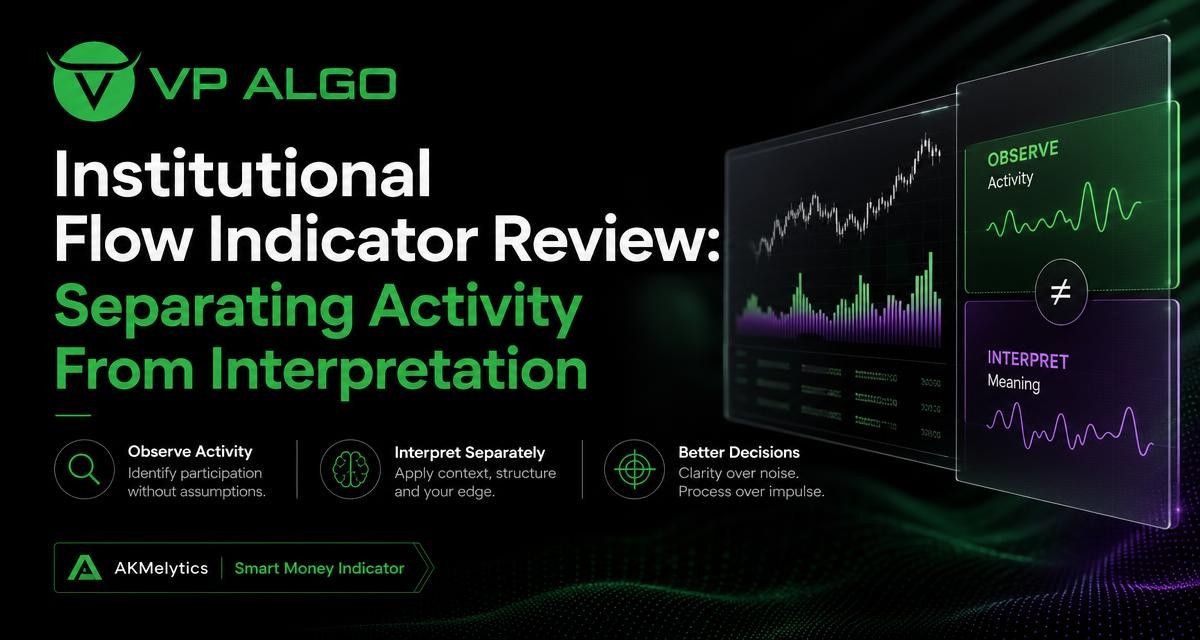
An institutional flow indicator can add useful context to a chart, but activity is not the same as intent and neither is a guaranteed trade signal. A careful review separates what the indicator displays from what a trader may reasonably infer after considering trend, momentum, market structure, volatility and timeframe.
What an institutional flow indicator is designed to show
The phrase “institutional flow” is often used to describe information associated with participation, market movement and smart money concepts. In practice, an indicator may represent this information through a combination of calculations, market-structure events, momentum readings, trend conditions and other chart data. It should therefore be read as an analytical aid rather than as a direct window into every institution’s orders or intentions.
This distinction matters because a visual indication of increased activity does not automatically explain why the market moved, whether the move will continue or whether a particular price level is suitable for a trade. The indicator can help organise observations on a TradingView chart. The trader still has to interpret those observations in context and manage the decision-making process independently.
Activity is an observation, not a conclusion
Suppose an indicator highlights a change in market flow or shows a structural event. The immediate observation might be that participation-related conditions have changed. The conclusion could be that the market is beginning a sustained trend, preparing for a reversal or simply reacting temporarily to volatility. Those conclusions are different, and the chart may not yet provide enough evidence to choose among them.
A useful review begins with neutral questions: What changed? On which timeframe? Is price making higher highs and higher lows, or lower highs and lower lows? Is momentum supporting the move? Has the market broken structure, or has it only moved through a short-term level? These questions turn an indicator display into a more disciplined analysis process.
Why context matters in trading technical analysis
Technical analysis works best when individual observations are considered together. An institutional flow indicator may be informative on its own, but its interpretation becomes more structured when combined with trend analysis, momentum evaluation and market structure. This does not make the resulting view certain. It simply reduces the risk of treating one isolated reading as a complete market explanation.
| Information to review | What it may help you observe | What it cannot prove by itself |
|---|---|---|
| Flow or participation-related reading | Whether the chart is showing a notable change in activity or market conditions | The exact identity, motive or future action of market participants |
| Trend analysis | The broader direction and consistency of price movement | That the current trend will continue indefinitely |
| Momentum evaluation | Whether price movement appears to have strength or is losing energy | That momentum will produce a profitable entry |
| Market structure | Breaks of structure, changes of character and important swing relationships | That a structural event will not fail or reverse |
| Volatility and projected levels | Reference points for thinking about movement, targets and risk | A guaranteed target, stop outcome or trade result |
Five layers for interpreting an institutional flow reading
1. Start with the market environment
Before focusing on a flow-related signal, identify the environment in which it appears. A directional market, a range and a highly volatile period can produce very different outcomes from similar indicator readings. A signal that appears during a well-defined trend may be interpreted differently from one that appears while price is moving back and forth around a broad range.
This first step is not about predicting the next candle. It is about avoiding a narrow reading of the chart. A participation-related observation has more meaning when you know whether price is expanding, consolidating, retracing or repeatedly rejecting the same area.
2. Check the higher-timeframe direction
Multi-timeframe analysis can help separate broader conditions from short-term movement. A lower-timeframe change may be relevant for timing, but it does not automatically overturn the larger trend. If the higher timeframe remains constructive while a lower timeframe turns weak, the chart may be showing a pullback rather than a complete reversal. The opposite situation can also occur.
Using more than one timeframe does not remove uncertainty. It gives the trader a way to ask whether signals are aligned, conflicting or simply describing different parts of the same price movement.
3. Examine market structure events
Market structure provides a framework for studying swing points and changes in price behaviour. Tools such as a break of structure, or BOS, and a change of character, or CHoCH, can help traders label an apparent continuation or shift. These labels are observations based on defined price relationships; they are not guarantees that a new trend has begun.
For example, a CHoCH may draw attention to a possible change in behaviour, but a trader may still want to see whether price can hold the relevant area, whether momentum supports the move and whether the larger timeframe agrees. A BOS can also fail if the market quickly returns through the broken level.
4. Review momentum and relative strength
Momentum helps answer a different question from flow analysis. Rather than asking who may be participating, it asks how forcefully price is moving and whether that force is strengthening or weakening. Relative strength and momentum readings can therefore add confirmation or expose disagreement.
When flow-related activity, trend direction and momentum point in the same direction, the chart may present a more coherent scenario for further study. When they conflict, that disagreement is information too. It may suggest a transition, a pullback, a range or a market that does not yet offer a clear setup.
5. Consider volatility and reference levels
Volatility affects how far price can move and how quickly a setup can become invalid. Volatility-based target and risk reference levels can help traders think in terms of possible movement rather than relying on arbitrary distances. They should remain reference points, not promises about where price will go.
Fibonacci projections and other mapped levels may also help organise a chart. Their value comes from placing a potential scenario in a defined framework. They do not turn an uncertain forecast into a certain outcome.

How to use an indicator without confusing it with a signal service
A TradingView indicator is best treated as part of a repeatable analysis workflow. It can bring several observations into one chart, but the trader determines how those observations fit the chosen method, timeframe and risk process. This is different from assuming that every highlighted event is an instruction to buy or sell.
For a structured review, record the following before considering a potential setup:
- The current higher-timeframe trend and the shorter-timeframe condition.
- The flow-related observation and the exact chart area where it appears.
- Any BOS or CHoCH event and whether price has held the related level.
- Momentum or relative-strength behaviour, including any disagreement with price.
- Relevant volatility, projection or risk reference levels.
- The condition that would invalidate the market view.
This process encourages evidence-based thinking. It also makes it easier to review decisions later, because the trader can distinguish what the indicator displayed from what they assumed it meant.
Where AKMelytics – Smart Money Indicator fits
AKMelytics – Smart Money Indicator is a TradingView technical analysis tool that brings together several types of chart information. Its described features include momentum, trend analysis, market structure, market flow, relative strength and smart money concepts. It also includes multi-timeframe analysis, BOS and CHoCH structure events, Fibonacci projections, volatility-based target and risk reference levels, dashboard context and configurable TradingView alerts.
That combination can be useful for traders who want to examine participation-related information alongside the surrounding market context. The value is not in treating one display as a prediction. It is in using the available views to build a clearer question about the chart: Is the market trending, changing structure, gaining momentum, losing momentum or moving without sufficient confirmation?
A practical review sequence
- Choose the timeframe relevant to the analysis and note the higher-timeframe direction.
- Review the indicator’s flow, trend and smart money-related information without immediately assigning a trade direction.
- Check whether market structure shows continuation or a possible change in behaviour.
- Compare the observation with momentum and relative-strength conditions.
- Mark relevant projection, volatility and risk reference levels.
- Define what evidence would support the scenario and what would invalidate it.
- Only then decide whether the setup deserves further consideration within the trader’s own plan.
Common mistakes when reading institutional flow tools
Assuming “institutional” means infallible
The label can make a reading sound more authoritative than it is. Institutional activity is complex, and an indicator’s representation of flow-related conditions should not be confused with confirmed knowledge of every participant’s orders. No label removes market uncertainty.
Using one timeframe in isolation
A short-term reading may look compelling while the broader market is moving in the opposite direction. Reviewing multiple timeframes can expose this conflict and help prevent a local event from being treated as the entire market trend.
Entering immediately after a structural event
BOS and CHoCH events can focus attention, but they do not guarantee follow-through. Price may retest the level, continue unevenly or reverse. Waiting for the rest of the context to develop can produce a more balanced analysis than reacting to the label alone.
Confusing alerts with decisions
Configurable alerts can make it easier to monitor chart conditions. An alert is a notification that a defined event may have occurred. It is not a complete assessment of trend, momentum, volatility, risk or suitability.
Looking for certainty instead of a testable scenario
Good technical analysis does not need to predict every market move. A stronger approach defines a scenario, identifies supporting evidence and states what would show that the scenario is no longer valid. This keeps the indicator in its proper role: decision-making assistance rather than a guarantee of results.
Questions to ask before relying on a reading
Before using any institutional flow indicator in a live decision process, review how its information fits your own method. Consider whether you understand the displayed concepts, how the signals behave across your chosen timeframes and whether you can explain the difference between an observation and an interpretation.
- Am I studying activity, or am I assuming I know participant intent?
- Does the higher timeframe support the shorter-timeframe reading?
- Do momentum and market structure provide consistent context?
- What would invalidate this market view?
- Am I using the tool for analysis rather than expecting guaranteed buy or sell outcomes?
VP ALGO TRADING positions its indicators for educational and trading-decision assistance purposes, not as financial advice. Traders should evaluate the tool within their own research, risk controls and trading plan. An indicator can organise information, but it cannot remove losses or make future results certain.
Frequently asked questions
What does an institutional flow indicator show?
It may display participation-related or market-flow information through calculations involving trend, momentum, structure and smart money concepts. It does not prove the exact intentions of institutions or predict future price movement.
Is an institutional flow indicator a buy and sell indicator?
It may help traders evaluate potential setups, but a reading should not automatically be treated as a buy or sell instruction. Trend, momentum, structure, volatility and personal risk rules still require separate consideration.
Why combine flow information with market structure?
Flow-related information describes one aspect of market conditions, while market structure shows how price is behaving around swing points and key events. Reviewing both can provide a more complete analytical context.
What are BOS and CHoCH?
BOS generally refers to a break of structure, while CHoCH refers to a change of character. They are chart-based ways of describing possible continuation or change in price behaviour, not guarantees of a new trend.
Can multi-timeframe analysis improve interpretation?
It can help distinguish broader direction from shorter-term movement and reveal when timeframes agree or conflict. It cannot eliminate uncertainty or guarantee that a setup will succeed.
Does AKMelytics provide financial advice?
No. AKMelytics – Smart Money Indicator is presented as a TradingView analysis tool for educational and trading-decision assistance. It is not a substitute for personalised financial advice.
How should traders evaluate an institutional flow reading?
Start with the market environment, review higher-timeframe direction, check structure and momentum, consider volatility and define invalidation conditions. Then decide whether the scenario fits your own trading plan and risk process.


Recent Comments