
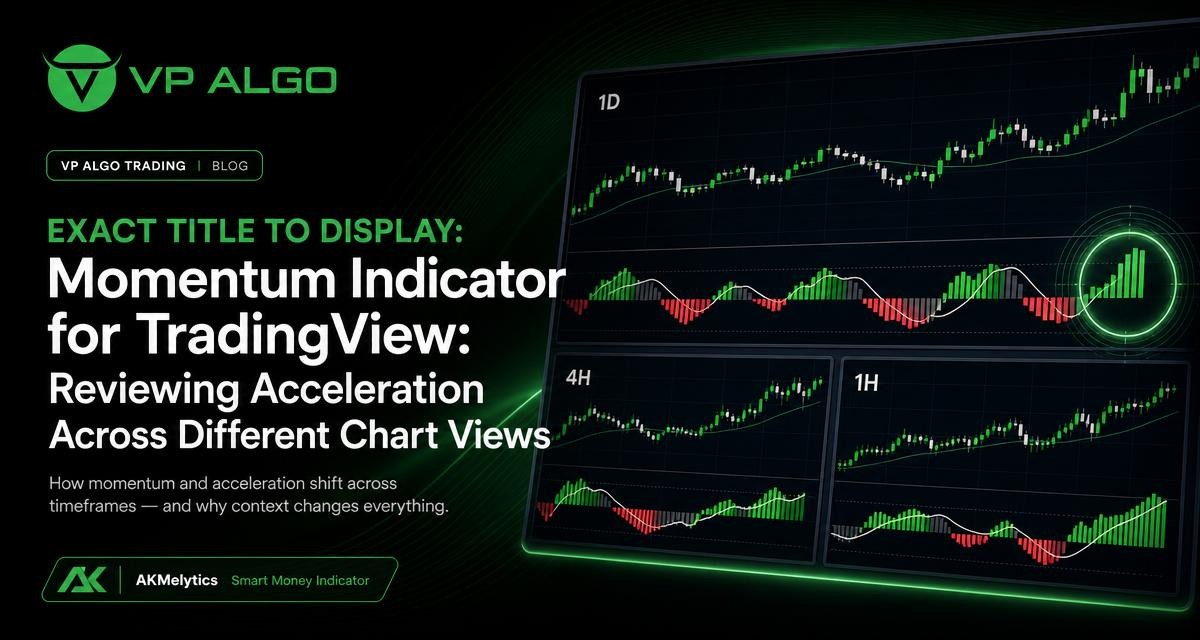
A momentum indicator for TradingView can help traders document how quickly price is moving, but momentum rarely tells the whole story on its own. The same market may appear to be accelerating on a short-term chart while losing strength on a broader view. Reviewing several chart timeframes, recording the direction of movement, and adding trend and market-structure context can create a more balanced way to evaluate potential trading setups.
What momentum means when reviewing a chart
Momentum describes the force or speed behind a price move. It is different from direction alone. A market can be rising while its upward momentum is weakening, or it can be moving sideways while a new burst of activity begins to develop. This distinction matters because a trend that is still pointing upward may not have the same strength as it had earlier in the move.
On TradingView, momentum observations may come from an indicator, price movement, candle behaviour, relative strength readings, or a combination of these elements. The purpose is not to treat one reading as a guaranteed signal. Instead, momentum should be documented as one part of a structured review that also considers trend direction, market structure, volatility and the chart timeframe.
Why momentum can look different across chart views
Each timeframe compresses a different amount of market activity into its candles. A short-term chart shows smaller fluctuations and more immediate changes, while a broader chart places those changes within a larger sequence. As a result, acceleration on one chart view may represent only a temporary move inside a wider consolidation or retracement.
For example, a strong upward sequence on a lower timeframe may be a reaction from support within a broader downtrend. Conversely, a quiet lower-timeframe chart may appear unremarkable while the higher timeframe shows a developing structural shift. Neither view is automatically more useful in every situation. They answer different questions.
| Chart view | Useful momentum question | Context to record |
|---|---|---|
| Higher timeframe | Is the broader market accelerating, slowing or ranging? | Major trend direction, key structural areas and broad volatility |
| Intermediate timeframe | Is the current move supporting or opposing the wider direction? | Continuation, retracement, breakout attempt or consolidation |
| Lower timeframe | Is there immediate acceleration or rejection? | Recent price behaviour, structure events and potential timing context |
The key is to avoid treating a timeframe as an isolated source of truth. A useful review records what each view shows and then asks whether those observations agree, conflict or describe different stages of the same move.
A practical framework for documenting acceleration
1. Start with the broader direction
Begin with the chart view that gives the widest useful context for the instrument and analysis being performed. Record whether price is generally advancing, declining or moving within a range. Then note whether recent movement appears to be extending that direction or challenging it.
This first step prevents a short-term momentum reading from becoming the entire analysis. If the broader chart is in a decline, a lower-timeframe rise can be documented as an upward counter-move rather than automatically labelled a new bullish trend.
2. Describe acceleration instead of using a simple yes-or-no label
Momentum is rarely static. A useful journal can describe it as increasing, stable, weakening, mixed or unclear. These descriptions are more informative than simply marking momentum as bullish or bearish because they acknowledge that direction and acceleration can change at different speeds.
- Increasing: price is extending movement with stronger follow-through than the recent baseline.
- Stable: price continues in the same direction without a clear change in force.
- Weakening: price still moves in the current direction, but follow-through appears less decisive.
- Mixed: different chart views or related observations point in different directions.
- Unclear: the market is too compressed, volatile or irregular for a confident description.
These labels are observations, not predictions. They help create a repeatable record of what the chart showed at a particular time.
3. Compare price movement with structure
Momentum becomes more meaningful when compared with market structure. A move that produces a clear structural continuation may deserve a different description from a move that remains trapped inside an established range. Structure events such as a break of structure, often abbreviated as BOS, or a change of character, often abbreviated as CHoCH, can add context to the acceleration being observed.
Neither event should be treated as an automatic trading instruction. The practical question is whether price movement, momentum behaviour and structure are telling a compatible story. If momentum appears strong but price has not changed the relevant structure, the observation may represent an internal move rather than a confirmed broader transition.
How to compare momentum across multiple timeframes
A multi-timeframe review works best when each chart has a defined role. The exact timeframes can vary according to the trader’s process, but the logic remains consistent: use a broader view for context, an intermediate view for development, and a lower view for detail.
Higher-timeframe momentum
The higher timeframe helps establish the market’s larger condition. Look for the direction of successive swings, the size of recent movements and whether price is expanding away from or returning toward important structural areas. A higher-timeframe momentum reading that is weakening does not necessarily mean an immediate reversal; it may indicate that the existing move is pausing or entering a consolidation phase.
Intermediate-timeframe momentum
The intermediate view helps explain how the current move relates to the broader condition. If the broader chart is rising and the intermediate chart begins to show renewed upward acceleration, the two views may be aligned. If the intermediate chart moves sharply in the opposite direction, it may represent a retracement, a transition or a deeper challenge to the larger trend. Additional structure and price context are needed before choosing a label.
Lower-timeframe momentum
The lower timeframe reveals immediate changes in participation and price behaviour. It can show whether a recent push is extending, stalling or being rejected. However, it also contains more short-term noise. A lower-timeframe momentum reading should therefore be recorded alongside the broader condition rather than allowed to override it without explanation.
| Observation | Possible interpretation | What to check next |
|---|---|---|
| All views show rising momentum | Acceleration is broadly aligned | Check structure, volatility and nearby areas of interest |
| Lower view rises while higher view falls | Short-term recovery or counter-trend movement | Assess whether broader structure has changed |
| Higher view rises while lower view weakens | Pullback, pause or temporary loss of force | Review support, structure and renewed follow-through |
| Momentum is mixed on every view | Market may be ranging or transitioning | Wait for clearer context in the analysis process |
Using a trend indicator for TradingView with momentum observations
A trend indicator for TradingView can help separate the question of direction from the question of acceleration. Trend analysis asks where price is generally moving, while momentum analysis asks how forcefully that movement is developing. Keeping those questions separate can reduce the temptation to describe every strong candle as a new trend.
For instance, an upward trend reading with weakening momentum may describe a market that is still structurally positive but losing speed. A downward trend reading with improving short-term momentum may describe a recovery inside a larger decline. Recording both conditions produces a more precise summary than using a single bullish or bearish label.
Trend and momentum can also disagree during transitions. That disagreement is not necessarily an error in the indicator or the analysis. It may be a sign that the market is moving from one condition to another. The appropriate response is to document the conflict, review the structure and avoid presenting uncertainty as confirmation.
Adding market structure and smart money context
Momentum analysis can be broadened by considering market structure, market flow and smart money concepts. These areas do not remove uncertainty, but they can help organise the evidence surrounding a move. A trader may ask whether acceleration occurs near a meaningful structural level, follows a break, or appears after a rejection from an area that has already influenced price.
The AKMelytics – Smart Money Indicator is a TradingView technical analysis tool designed to bring several of these observations into one review. Its described features include momentum, trend analysis, market structure, market flow, relative strength and smart money concepts. It also includes multi-timeframe analysis, BOS and CHoCH structure events, Fibonacci projections, volatility-based target and risk reference levels, dashboard context and configurable TradingView alerts.
These features can support documentation, but they should not be interpreted as a guarantee that a market will continue in the observed direction. An indicator can organise information and highlight conditions for further study; it cannot eliminate market uncertainty or replace a trader’s own risk assessment.
A repeatable momentum review process
To make observations more useful, use the same sequence each time you review a chart. Consistency makes it easier to compare notes and identify where interpretations changed. The following process can be adapted to a personal TradingView workflow.
- Record the chart context. Note the instrument, date, chart views and general market condition being reviewed.
- Describe the broader direction. Mark the higher-timeframe trend as advancing, declining, ranging or unclear.
- Assess acceleration. Record whether momentum is increasing, stable, weakening, mixed or unclear on each view.
- Review structure. Note relevant swing behaviour, BOS, CHoCH, consolidation or rejection without treating the observation as a guaranteed outcome.
- Compare the views. State whether the timeframes are aligned, partially aligned or in conflict.
- Identify nearby context. Consider volatility, market flow, relative strength and structural areas that may affect interpretation.
- Write the uncertainty clearly. If the evidence is incomplete or conflicting, say so in the record.
A simple note might read: “The broader chart remains upward, intermediate momentum is stable, and the lower chart shows a short-term acceleration after a pullback. Structure has not yet confirmed a wider change.” This is more useful than writing only “bullish momentum” because it explains what was observed and where the limitations are.
Common mistakes when reading momentum across chart views
Confusing acceleration with trend reversal
A sharp move in the opposite direction can be significant, but it is not automatically a reversal of the broader trend. Check whether relevant structure has changed and whether the move is sustained beyond a short-term reaction.
Ignoring timeframe conflict
When chart views disagree, selecting only the most favourable reading can create confirmation bias. Record the disagreement instead. Mixed evidence may indicate a transition, a range or a market that requires more context before it can be described confidently.
Using too many observations without a hierarchy
More signals do not necessarily create better analysis. If trend, momentum, structure, relative strength and flow are all listed without explaining their roles, the result can become difficult to interpret. Assign each observation a clear purpose and prioritise the broader context.
Treating alerts as decisions
Configurable TradingView alerts can help draw attention to a condition, but an alert is not the same as a complete market review. The surrounding chart, timeframe alignment, structure and risk considerations still require examination.
Where the AKMelytics indicator fits
Traders looking for a structured TradingView workspace may use the AKMelytics – Smart Money Indicator to review several dimensions of market behaviour together. Its multi-timeframe features are relevant when momentum changes between broader and shorter chart views, while its trend, structure, flow and smart money components can provide additional context for the written review.
The tool is intended to support analysis of potential trading setups and decision-making, not to provide financial advice. VP ALGO TRADING also describes its indicators and software as educational and decision-support tools. Traders should evaluate the information independently, apply their own process and recognise that no indicator can guarantee a particular market result or remove the possibility of loss.
Final checklist for a documented momentum review
- Have you defined the role of each chart timeframe?
- Have you separated trend direction from momentum strength?
- Have you described acceleration rather than relying on a single label?
- Have you checked whether market structure supports the interpretation?
- Have you recorded conflicts between chart views?
- Have you considered volatility and nearby structural context?
- Have you avoided presenting an indicator reading as a guarantee or financial recommendation?
A momentum indicator for TradingView is most useful when it helps create a disciplined record of changing market conditions. Reviewing acceleration across different chart views, then comparing those observations with trend and structure, gives traders a clearer framework for understanding what the chart is showing—and what it is not showing.
Frequently asked questions
What is a momentum indicator for TradingView?
It is a TradingView analysis tool or method used to assess the speed and force of price movement. Momentum readings are best considered alongside trend direction, market structure and broader chart context.
Why does momentum look different on different timeframes?
Each timeframe displays a different portion and compression of market activity. A short-term acceleration may be part of a larger retracement, while a broader change may develop gradually across several lower-timeframe movements.
Can momentum confirm a trend by itself?
Momentum alone does not provide complete confirmation. It should be compared with price structure, trend direction, volatility and the behaviour visible on other relevant chart views.
How is a trend indicator for TradingView different from a momentum indicator?
A trend indicator generally focuses on the prevailing direction of price, while a momentum indicator focuses more on the strength or speed of movement. The two observations can agree or conflict during pauses and transitions.
What should I record when momentum readings conflict?
Record the reading from each timeframe, describe the broader direction, note relevant structure and explain the conflict. Mixed momentum may reflect a retracement, range or transition rather than a clear directional condition.
Does the AKMelytics – Smart Money Indicator guarantee trading results?
No. It is designed to support technical analysis and decision-making. It does not provide financial advice, guarantee results or eliminate the possibility of trading losses.


Recent Comments