
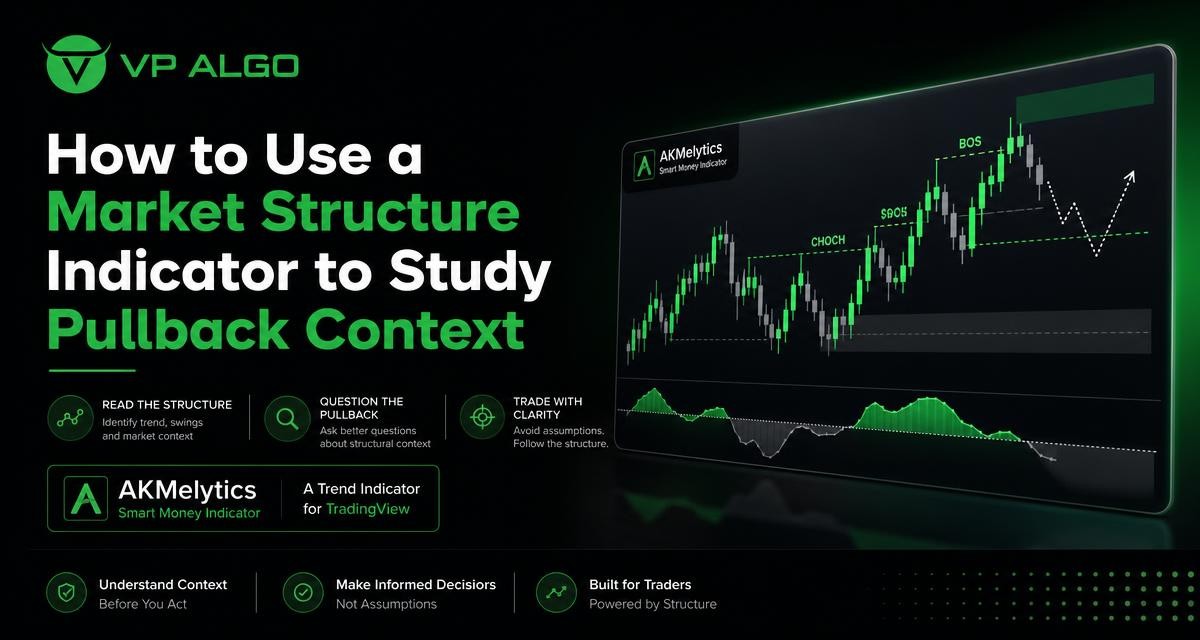
A market structure indicator can help traders study what a pullback means within the wider movement of a market. Instead of treating every retracement as an automatic buying or selling opportunity, traders can use structural information to ask whether the pullback is aligned with the prevailing trend, weakening momentum, or developing into a possible change in direction.
Why pullback context matters
A pullback is a temporary movement against a recent directional move. In an upward market, price may retreat after forming higher highs; in a downward market, price may bounce after creating lower lows. The same visual pattern can have very different meanings depending on the surrounding structure.
For example, a decline during a broader sequence of higher highs and higher lows may represent a pause in the trend. However, a similar decline that breaks an important swing low may suggest that the previous structure is no longer holding. Looking only at the candles inside the pullback can therefore provide an incomplete view.
A market structure indicator is useful because it can organize several observations on the chart. It may help identify structure events such as a break of structure, often abbreviated as BOS, or a change of character, commonly called CHoCH. These labels do not decide what a trader should do. They provide a framework for examining how price is behaving.
What to examine before interpreting a pullback
1. Identify the broader directional structure
Begin with the larger chart context rather than the first candle that catches your attention. Ask whether price has recently been forming higher highs and higher lows, lower highs and lower lows, or a less defined range. A pullback inside a clear directional sequence should be viewed differently from a retracement that occurs in a sideways market.
A trend indicator for TradingView can provide additional context by displaying directional conditions across one or more timeframes. This does not make the direction certain, but it can make it easier to compare the short-term movement with the broader structure.
2. Mark the swing points that matter
Not every minor fluctuation has the same structural importance. Focus on the swing points that price respected before the current pullback began. These areas can help you assess whether the retracement is still contained within the prior structure or is beginning to challenge it.
The appropriate level of detail depends on the timeframe and the market being studied. Excessive labels can make a chart harder to interpret, while too few reference points may hide a meaningful change. A configurable market structure indicator can help traders adjust the display to suit their analysis process.
3. Look for a confirmed structural event
A pullback may remain a pullback until price breaks a meaningful structural reference. A break of structure in the direction of the existing trend can support the view that the broader movement remains intact. A break against that trend may prompt a different question: is the market transitioning, or has a temporary violation occurred inside a larger range?
These events should be evaluated with the chart timeframe and candle confirmation in mind. A single intrabar move or isolated wick may not carry the same significance as a confirmed close beyond a relevant swing point. The indicator can highlight events, but the trader still needs to assess their location and quality.
A practical framework for studying pullback context
The following sequence can help turn a visual chart review into a repeatable observation process. It is not a trading signal or a guaranteed method. Its purpose is to encourage traders to evaluate context before focusing on a possible entry.
- Start with the higher timeframe. Note the broad direction, range, or lack of clear structure.
- Move to the analysis timeframe. Identify the recent impulse and the retracement that followed it.
- Review the relevant swing points. Mark the levels that would support or weaken the current structural interpretation.
- Check momentum. Consider whether momentum is sustaining the original move or fading during the pullback.
- Examine market flow and participation context. Treat any displayed flow or smart money information as an additional input, not proof of future price direction.
- Define what would invalidate the idea. Decide which structural development would make the original interpretation less convincing.
- Wait for the chart to provide enough information. Avoid treating an unfinished pullback as a confirmed opportunity.
Questions a market structure indicator can help you ask
Is the pullback occurring within an intact trend?
This is often the first question. If the key swing points remain intact and price continues to respect the broader sequence, the retracement may still be consistent with the prior trend. That observation is not a prediction. It simply describes the relationship between the current price movement and the established structure.
Has price broken a meaningful swing point?
A break of a minor internal level may have a different interpretation from a break of a major swing point. Compare the displayed event with the structure on the higher timeframe and ask whether the break changes the market narrative or only reflects short-term noise.
Is the pullback losing momentum?
Momentum can provide another layer of context. If the original move was strong but the retracement shows reduced momentum, the pullback may be slowing. On the other hand, an increasingly forceful move against the prior trend may deserve closer attention, particularly if it is also breaking important structure.
Does the lower timeframe agree with the higher timeframe?
Multi-timeframe analysis can reveal why a chart appears contradictory. A lower-timeframe bearish sequence may simply be a retracement inside a higher-timeframe bullish structure. Conversely, repeated lower-timeframe weakness can become more significant if the higher-timeframe structure is already uncertain.
Where are risk and target references located?
Some indicators display volatility-based target and risk reference levels or Fibonacci projections. These tools can help traders plan what to monitor, but they should not be treated as forecasts or guarantees. A reference level is most useful when it is considered alongside structure, volatility, market conditions, and the trader’s own risk process.

How indicator features can support the review
| Feature | What it may help you examine | Question to ask |
|---|---|---|
| Market structure labels | Breaks of structure and possible changes of character | Did price break a meaningful swing point? |
| Multi-timeframe trend assessment | Relationship between local movement and broader direction | Are the timeframes aligned or conflicting? |
| Momentum analysis | Strength or weakening of the current move | Is the pullback gaining or losing force? |
| Market flow and smart money context | Additional information about displayed activity and conditions | Does this support the chart context, or introduce uncertainty? |
| Fibonacci projections | Potential reference areas within the current analysis | Does the area overlap with relevant structure? |
| Volatility-based levels | Possible risk and target reference points | Are the levels realistic for the current volatility? |
| Dashboard and alerts | Organizing information and monitoring selected events | Will this reduce missed observations without encouraging automatic decisions? |
The AKMelytics – Smart Money Indicator for TradingView combines information related to momentum, trend analysis, market structure, market flow, relative strength, and smart money concepts. It also includes multi-timeframe analysis, BOS and CHoCH events, Fibonacci projections, volatility-based references, dashboard context, and configurable alerts. These features are intended to support analysis of potential setups and decision-making, not to replace independent judgment.
Pullback context across different market conditions
Clear directional movement
In a clearly directional market, traders may study whether the pullback remains above or below the structural level that supports the current trend. They can also compare the retracement’s momentum with the momentum of the preceding impulse. A shallow or slow pullback and a fast, aggressive reversal may carry different contextual information, even when both move against the trend.
Range-bound conditions
In a range, apparent pullbacks can be misleading because price may repeatedly move between boundaries without establishing a sustained trend. Structure labels should therefore be considered in relation to the wider range. A small break in the middle of a range may be less meaningful than price behavior near a clearly observed boundary.
Conflicting timeframes
When timeframes disagree, the disagreement itself is useful information. A trader might record the higher-timeframe structure, the lower-timeframe pullback direction, and the levels at which the two views would become more consistent. This approach is generally more disciplined than forcing every chart into a single bullish or bearish label.
Common mistakes when analysing pullbacks
- Treating every retracement as an entry. A pullback is a description of price movement, not an automatic setup.
- Ignoring the higher timeframe. Local structure can look clear while remaining part of a larger range or opposing trend.
- Reacting to every label. BOS and CHoCH markers require context, including the level broken and the timeframe involved.
- Using too many indicators without a process. More information can create confusion if each display is interpreted independently.
- Assuming alerts are decisions. An alert can draw attention to an event, but it does not assess suitability, risk, or future outcome.
- Focusing only on possible targets. A target reference has limited meaning without a clearly considered invalidation point and risk plan.
- Confusing educational analysis with financial advice. Indicator readings are analytical inputs and should not be treated as personalized recommendations.
Creating a simple pullback review checklist
A written checklist can help reduce impulsive interpretation. Before considering a potential setup, record the market’s broader structure, the direction of the current pullback, the relevant swing level, and the evidence that would weaken your initial view.
You can also note whether momentum agrees with structure, whether the timeframes are aligned, and whether the chart is trending or ranging. If the answers are unclear, the appropriate conclusion may simply be that more information is needed. No trade decision is required merely because an indicator has highlighted an event.
Reviewing completed charts can improve consistency. Compare what the indicator showed at the time with what became clear later, while remembering that historical examples do not guarantee future results. The purpose of review is to understand your process and identify where your interpretation was premature, not to assume that the same outcome will repeat.
Using a TradingView indicator responsibly
A TradingView indicator can make technical information easier to organize, particularly when it combines trend, momentum, structure, and multi-timeframe views. It cannot remove uncertainty from financial markets or determine whether a trade is appropriate for an individual trader. The quality of the analysis still depends on how the information is interpreted and how risk is considered.
VP ALGO TRADING develops and sells indicators and algorithmic trading tools for TradingView. Its smart money indicator tools are positioned for educational and trading-decision assistance rather than official financial advice. Traders using the AKMelytics – Smart Money Indicator should treat structure events, alerts, projections, and dashboard readings as inputs for research and chart analysis.
Frequently asked questions
What is a market structure indicator?
A market structure indicator is a charting tool that helps display relationships between swing highs, swing lows, breaks of structure, and possible changes in market direction. It organizes observations but does not guarantee what price will do next.
Can a market structure indicator identify every valid pullback?
No. Pullbacks vary across markets, timeframes, and conditions. The indicator can help highlight structural information, but traders still need to assess trend, momentum, timeframe alignment, volatility, and invalidation levels.
What do BOS and CHoCH mean?
BOS generally refers to a break of structure, while CHoCH refers to a change of character. Their exact interpretation depends on the swing points involved, the timeframe, and the wider market context.
Is a pullback automatically a trading opportunity?
No. A pullback is simply a movement against a recent direction. It may continue, reverse, form part of a range, or develop into a larger structural change. Additional analysis is needed before considering any potential setup.
Why use multiple timeframes when studying a pullback?
Multiple timeframes can show whether a short-term retracement is occurring inside a broader trend or whether it is part of a larger reversal. Conflicting readings should be treated as uncertainty rather than forced into agreement.
Can alerts replace chart analysis?
No. Alerts can notify traders about selected events, but they do not evaluate the full context, personal risk tolerance, or suitability of a decision. They are best used as monitoring aids.
Does the AKMelytics – Smart Money Indicator provide financial advice?
No. It is a TradingView technical analysis tool designed to support analysis and trading decisions. It is not a financial adviser and does not guarantee profits or eliminate trading losses.


Recent Comments