
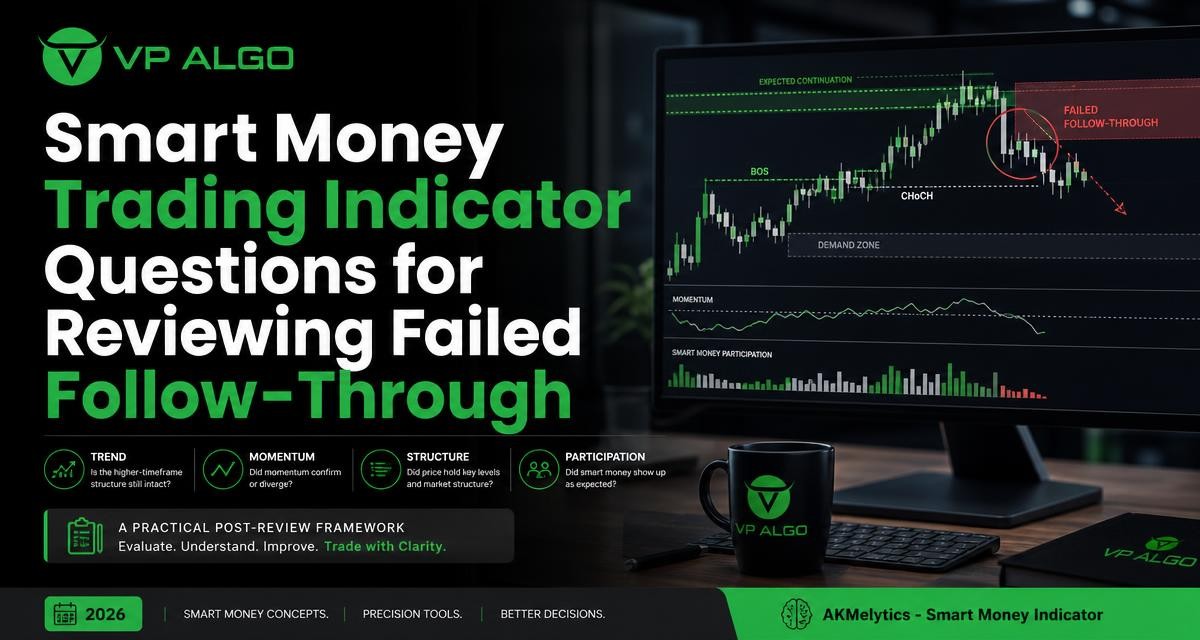
When an expected continuation does not develop, the most useful question is not simply whether the entry was wrong. A structured review can show whether the broader trend weakened, momentum failed to confirm, market structure changed, or participation did not support the move. A smart money trading indicator can help organize that review by bringing trend analysis, momentum, structure, market flow and multi-timeframe context into one analytical process.
What failed follow-through can reveal
Failed follow-through occurs when price appears ready to continue in one direction but then stalls, retraces deeply or moves through a level that was expected to hold. The initial idea may have been based on a break of structure, a pullback in an established trend, a momentum expansion or a perceived smart money setup. Once the expected move does not continue, the chart contains new information that deserves careful examination.
This review is not about proving that an indicator or a trade idea was right or wrong in isolation. It is about identifying which conditions were present, which conditions were missing and when the evidence changed. That distinction helps separate a reasonable setup that met its conditions from an assumption that was never fully supported by the chart.
Separate the trade thesis from the trade outcome
A losing or unsuccessful trade does not automatically mean the analysis was careless. Markets can fail to follow through for many reasons, and no indicator can remove uncertainty. Conversely, a trade that reaches a favorable outcome does not prove that the original reasoning was sound. Review the evidence available at the time of the decision before judging the result.
Record the expected direction, the structural level that mattered, the timeframe used for context, the momentum condition and the event that would invalidate the idea. Then compare that record with what actually happened. This creates a repeatable process instead of a review driven by hindsight.
A four-part framework for reviewing continuation failures
A practical review can be organized around four questions: Was the trend still aligned? Did momentum support continuation? Did market structure remain intact? Was there enough participation or market-flow confirmation? These questions overlap, but each examines a different part of the setup.
| Review area | Key question | Warning sign |
|---|---|---|
| Trend | Was the expected direction still supported across the relevant timeframes? | Higher-timeframe direction conflicted with the entry timeframe. |
| Momentum | Did price expansion continue after the initial signal? | The move weakened, stalled or failed to produce follow-through. |
| Market structure | Did the important swing points and structural levels hold? | A break of structure was rejected or followed by a contrary change of character. |
| Participation | Was the move supported by the market-flow or smart money context being monitored? | Price moved without confirming participation or broader context. |
Question one: Was the trend actually aligned?
Many continuation ideas begin with a directional assumption. Price may have been making higher highs and higher lows, or lower highs and lower lows, on the chart being watched. The first review question is whether that directional picture was still valid when the entry or continuation signal appeared.
A trend indicator for TradingView can help summarize directional conditions, but it should not replace inspection of price structure. Examine whether the broader timeframe supported the same direction as the execution timeframe. A short-term bullish signal inside a weakening higher-timeframe decline may have been a countertrend move rather than a continuation setup.
Review the trend across more than one timeframe
Multi-timeframe analysis is useful because trends can look different depending on the chart interval. A lower timeframe may show a temporary recovery while a higher timeframe remains under pressure. The reverse can also occur when a short-term pullback appears bearish inside a larger upward structure.
When reviewing the chart, note the timeframe that supplied the directional context and the timeframe that supplied the entry information. Ask whether the two were aligned, neutral or in conflict. If the indicator dashboard or trend assessment showed mixed conditions, that uncertainty should be recorded rather than treated as confirmation.
- Identify the higher-timeframe directional condition.
- Record the intermediate structure that shaped the setup.
- Compare it with the lower-timeframe signal.
- Note whether the continuation required a trend transition that had not yet been confirmed.
Question two: Did momentum support the expected move?
A break or pullback can appear convincing at first, but continuation usually requires enough momentum to carry price beyond the initial area of interest. If price reaches the expected level and then produces small candles, repeated rejection or a narrow range, the original impulse may be losing strength.
A momentum indicator for TradingView can help place that behavior in context. The purpose is not to search for a single reading that predicts the next candle. Instead, compare the momentum condition before the signal with the condition after the signal. Did momentum expand in the expected direction, remain stable or deteriorate?
Look for momentum disagreement
Momentum disagreement does not automatically invalidate a setup, but it is a reason to reduce confidence and examine the structure more closely. For example, price may reach a new extreme while the momentum context fails to show a comparable expansion. A continuation attempt may also lose momentum immediately after breaking a visible level.
During the review, mark the point where momentum changed. Was the change visible before entry, immediately after entry or only after the setup had already been invalidated? Timing matters because a condition that changes after the decision should be treated differently from a warning that was already present.
Question three: Did market structure confirm or reject the idea?
Market structure provides the framework for defining continuation and failure. Important swing highs, swing lows, breaks of structure and changes of character can show whether the directional sequence remains intact. If the level supporting the trade thesis was broken and then reclaimed, or if a supposed break was quickly rejected, the event deserves a separate review.
A market structure indicator can make these events easier to identify consistently, particularly when the chart contains several swings across different timeframes. However, automated markings still require interpretation. Not every visible swing has equal significance, and a structural event on one timeframe may have limited meaning on another.
Review BOS and CHoCH events in context
A break of structure, often abbreviated as BOS, is generally examined as evidence that an existing sequence may be continuing. A change of character, or CHoCH, is commonly used to describe a possible shift in directional behavior. These labels are useful for organizing a chart review, but they should be connected to the specific swing points that produced them.
Ask the following questions:
- Which swing point was broken?
- Was the break decisive or quickly rejected?
- Did the break occur with supporting momentum?
- Was the event aligned with the higher-timeframe structure?
- Did a later CHoCH challenge the original continuation thesis?
When a continuation fails, the first structural event after the failure can be especially informative. It may show that the market was already transitioning before the entry, or that the apparent transition was only a short-lived reaction.

Question four: Was participation consistent with the setup?
Price movement and participation are related but not identical. A chart can move through a level without providing the broader market-flow context that a trader expected. When reviewing a failed continuation, examine whether the participation or institutional-activity information being monitored supported the direction, remained mixed or shifted against it.
A smart money trading indicator may combine market-flow monitoring with trend, momentum and structure features to provide a broader view of conditions. That context can be useful, but it should be treated as analytical information rather than proof of what a particular market participant will do next. The review should focus on whether the participation signal was present and how it behaved around the failed follow-through.
Distinguish participation from confirmation bias
It is easy to interpret any movement after the fact as evidence of institutional activity or smart money involvement. A better process is to define the participation condition before reviewing the outcome. For example, record whether the indicator showed supportive flow, conflicting flow or no clear confirmation at the time of the setup.
If the condition was unclear, label it as unclear. A neutral reading is different from a confirming reading, and treating the two as equivalent can make future reviews less reliable.
How to use smart money concepts without oversimplifying them
Smart money concepts often bring together ideas such as liquidity, market structure, order-flow context and institutional activity. These concepts can provide a useful vocabulary for describing why a continuation might fail, but they are not a substitute for a defined review process.
For example, a move beyond a visible high or low may attract attention before price reverses. That behavior can be described using liquidity-related language, but the review still needs to identify the observable evidence: the level that was taken, the reaction that followed, the structural event afterward and the momentum condition during the reaction. Concrete observations are more useful than assigning a confident explanation without sufficient evidence.
Use the dashboard as a summary, not a shortcut
A dashboard can make it easier to see trend, momentum, structure and other context together. It can also highlight disagreement between conditions that may be difficult to spot when reviewing several chart elements separately. Still, the dashboard should lead back to the chart rather than replace it.
When a continuation fails, compare the dashboard state before the trade with the state after the failure. Note which component changed first. If structure changed before momentum, that may tell a different story from momentum weakening while structure remained intact. The sequence can help identify what deserves closer attention in future reviews.
A practical post-review checklist
Use a consistent checklist after the expected continuation fails. The aim is not to create a perfect explanation for every price movement. The aim is to build comparable records that reveal recurring conditions in your own analysis.
- Write down the original directional thesis in one sentence.
- Mark the structural level that was expected to hold or break.
- Record the trend condition on the context and execution timeframes.
- Compare momentum before the signal with momentum after the signal.
- Identify the first meaningful BOS, CHoCH or rejection after the setup.
- Record whether market-flow or smart money context confirmed, conflicted or remained unclear.
- Note the exact event that invalidated the continuation idea.
- Classify the review as a trend issue, momentum issue, structure issue, participation issue or mixed case.
Use the same terms each time. If one review calls a condition “weak participation” and another calls a similar condition “no flow confirmation,” the records may be harder to compare. Simple, consistent labels make patterns easier to recognize.
Common review mistakes to avoid
Judging the setup only by the final result
The final result is visible, but it does not contain the whole decision process. Review the chart as it appeared before the continuation failed. This helps prevent hindsight from turning every unfavorable outcome into an obvious mistake.
Treating every indicator element as a separate signal
A combined tool may display trend, momentum, structure, market flow, relative strength, projections and alerts. These elements are most useful when interpreted as parts of a single context. Counting each element as an independent vote can create false confidence because several readings may describe related price behavior.
Ignoring timeframe conflict
A lower-timeframe signal can be technically clear while still conflicting with a larger structural condition. Record the conflict explicitly. The presence of a signal does not remove the need to understand where that signal sits within the broader chart.
Changing the rules after the outcome
Do not add a new requirement only because the trade failed unless you are deliberately revising the method for future use. First record whether the original rules were followed. Then, separately, decide whether the review supports a change to those rules.
How an indicator can support a repeatable review process
The AKMelytics – Smart Money Indicator from VP ALGO TRADING is designed for TradingView analysis and brings together trading algorithms related to momentum, trend analysis, market structure, market flow, relative strength and smart money concepts. Its multi-timeframe context, BOS and CHoCH events, dashboard information, Fibonacci projections, volatility-based target and risk reference levels and configurable alerts can help organize the information used in a post-review.
These features should be used as aids for examining potential setups and decision-making, not as guarantees or financial advice. A structured tool can make the review more consistent, but the trader remains responsible for interpreting conditions, defining risk and deciding whether a setup fits their own process.
Turning failed follow-through into better questions
The most productive review question is often narrower than “Why did the trade fail?” Ask instead: Which condition stopped supporting continuation, and when did that change become visible? A trend review may reveal that the setup was counter to the broader direction. A momentum review may show that the initial impulse had already weakened. A structure review may identify a rejected break or a new change of character. A participation review may show that confirmation was absent or mixed.
Over time, these questions can help create a more disciplined record of how setups behave. The purpose is not to predict every failed move. It is to make the reasoning behind future analysis clearer, more testable and less dependent on hindsight.
Frequently asked questions
What is a smart money trading indicator used for?
A smart money trading indicator can help organize information about trend, momentum, market structure, market flow and smart money concepts. It is used to support chart analysis and review potential setups, not to guarantee a particular market outcome.
How should I review a failed continuation setup?
Review the trend, momentum, market structure and participation conditions separately. Compare the information available before the decision with what changed after the expected continuation failed.
Why is multi-timeframe analysis useful after follow-through fails?
Different timeframes can show different directional conditions. A lower-timeframe continuation may conflict with a weakening or opposing higher-timeframe structure, so reviewing both can clarify the context.
What does a failed break of structure indicate?
A failed break may show that price rejected the level or that the expected continuation lacked support. Examine the reaction, momentum and subsequent structure rather than treating the label alone as a complete explanation.
Can momentum confirmation prevent failed follow-through?
No. Momentum analysis can provide context, but it cannot remove market uncertainty or guarantee continuation. Its value is in showing whether the move was strengthening, weakening or mixed when the setup developed.
Is an indicator a substitute for a trading plan?
No. An indicator can help structure analysis, but a trading plan still needs defined conditions, invalidation criteria, risk decisions and a consistent review process. The indicator is an analytical aid rather than financial advice.


Recent Comments