
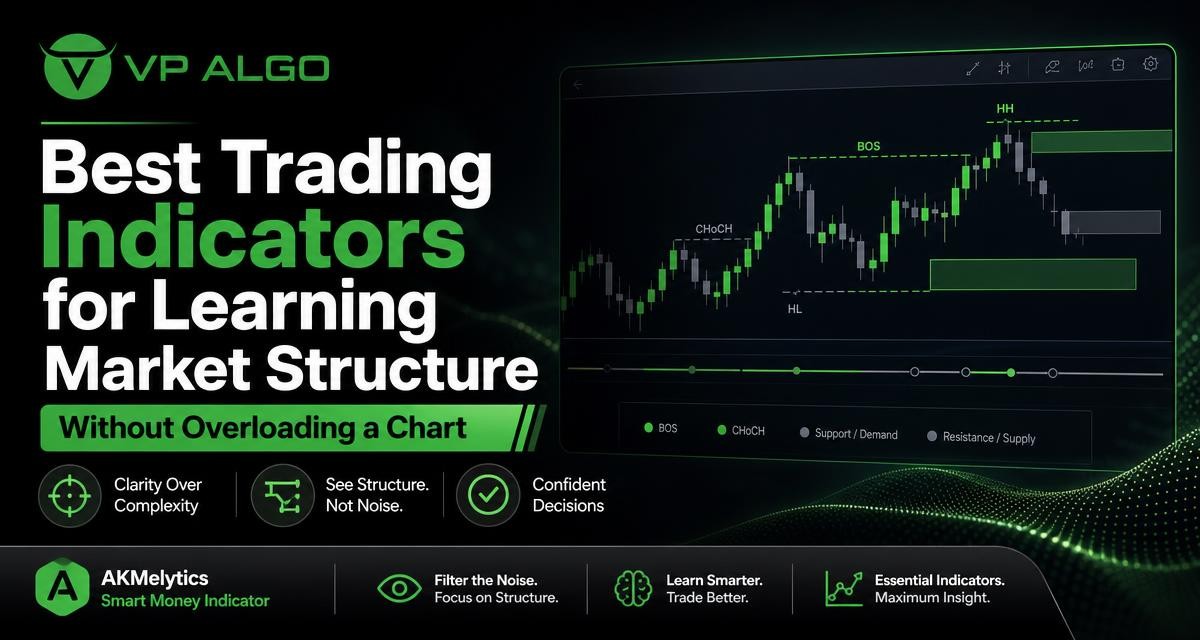
Finding the best trading indicators TradingView users can apply to market structure is less about adding more tools and more about choosing information that remains easy to read. A chart can show trend, momentum, swing points, flow and potential levels, yet still become difficult to interpret when every feature is displayed at once. For learners, the most useful indicator is usually the one that clarifies how price is behaving without replacing careful analysis.
What learners should look for in a market structure indicator
Market structure describes the way price develops through swing highs, swing lows, continuation and possible changes in direction. An indicator can help make these events more visible, but the chart should still encourage you to ask useful questions: Is price creating higher highs and higher lows? Is the current move breaking an earlier structure point? Is momentum supporting the move, or is price becoming weaker?
A good market structure indicator should present those clues in a way that is consistent and manageable. It should not force every possible signal onto the chart. Clear labels, adjustable settings and a logical relationship between structure and other forms of analysis are often more valuable than a long list of visual effects.
Structural information should come first
When learning, start with the basic structure rather than with entry markers. Look for swing points, breaks of structure and changes of character. These events can provide a framework for interpreting price action, but they are not automatic instructions to buy or sell. They need to be considered alongside the broader trend, momentum, volatility and the trader’s own risk process.
The aim is to understand the sequence behind a move. For example, a break of structure may show that price has moved beyond a previous swing point, while a change of character may suggest that the behaviour of the market is shifting. These observations can be useful for study, but they do not remove uncertainty or guarantee that a trend will continue.
How to compare the best trading indicators TradingView offers
TradingView gives traders access to many types of chart tools. The right comparison is not simply a contest between indicators with the most features. Instead, compare each tool by the question it helps answer, how clearly it displays information and how much additional interpretation it requires.
| Indicator category | Primary question | Useful contribution | Common risk when overused |
|---|---|---|---|
| Market structure indicator | How is price forming swings and breaks? | Highlights structure events and changes in price behaviour | Too many labels can make the chart difficult to follow |
| Trend indicator for TradingView | What is the broader directional context? | Helps organise analysis around trend conditions | A lagging reading may be treated as a prediction |
| Momentum indicator for TradingView | Does current movement have strength? | Adds context to acceleration, slowing or divergence | Repeated signals can distract from price structure |
| Flow or smart money tool | What does the available activity context suggest? | Provides another perspective on market flow and smart money concepts | Context may be mistaken for proof of institutional intent |
| Volatility reference tool | How wide or active is the current movement? | Helps frame potential target and risk reference levels | Reference levels can be treated as fixed outcomes |
This comparison shows why a combined TradingView indicator can be useful for learning when its components remain visually organised. A tool that brings related information together may reduce the need to switch between several separate studies. However, combining features does not automatically make analysis better. The display still needs to be configured so that the most important information receives attention first.
Market structure, trend and momentum work differently
One reason charts become overloaded is that traders treat different forms of analysis as if they answer the same question. Market structure focuses on the sequence of price swings. Trend analysis focuses on directional context. Momentum examines the strength or speed of movement. These areas overlap, but they are not interchangeable.
Market structure explains the sequence
Structure can help a learner describe what price has already done. A sequence of higher highs and higher lows presents a different context from a sequence of lower highs and lower lows. A break of structure can mark an important event within that sequence, while a change of character can draw attention to a possible transition.
The value of these observations comes from placing them in context. A structure event on a short timeframe may not carry the same meaning as one visible on a higher timeframe. This is why multi-timeframe analysis can be useful, provided that the trader understands which timeframe is being used for context and which is being used for detailed observation.
Trend analysis adds directional context
A trend indicator for TradingView can help summarise whether the market is currently behaving in a rising, falling or less directional manner. This can make a chart easier to scan, especially when the underlying price action contains many short-term fluctuations.
Trend information should be treated as context rather than certainty. A trend reading may reflect conditions that have already developed, and price can change direction. Learners should therefore compare the trend view with visible structure instead of allowing one coloured line, background or status label to determine the entire interpretation.
Momentum shows participation in the move
A momentum indicator for TradingView can help traders study whether movement is strengthening, slowing or losing consistency. Momentum may support a structure reading, but it can also present a more complicated picture. Price can continue moving while momentum weakens, and momentum can improve before a meaningful structural change appears.
Used carefully, momentum adds a second layer of information. Used carelessly, it creates a stream of alerts that encourages reaction to every small fluctuation. A cleaner chart usually gives momentum a supporting role rather than allowing it to compete with the primary structure view.
When a smart money indicator can simplify analysis
A smart money indicator can bring together concepts that many traders otherwise study through separate chart tools. Depending on its design, this may include market structure, market flow, institutional activity context, relative strength, momentum and multi-timeframe trend assessment. The practical benefit is not that the indicator predicts every move. The benefit is that related information can be reviewed from one organised interface.
AKMelytics – Smart Money Indicator is a TradingView technical analysis tool built around momentum, trend analysis, market structure, market flow, relative strength and smart money concepts. Its stated features include BOS and CHoCH structure events, multi-timeframe analysis, Fibonacci projections, volatility-based target and risk reference levels, dashboard context and configurable TradingView alerts.
What BOS and CHoCH can add to a learning process
BOS, or break of structure, can help identify when price moves beyond a relevant structural point. CHoCH, or change of character, can help draw attention to a possible change in the way price is behaving. These labels can make a study session more systematic because the learner has specific events to review rather than relying only on visual impressions.
They should still be treated as analytical references. A BOS label does not establish that a move will continue, and a CHoCH label does not confirm a complete reversal. The quality of the interpretation depends on the timeframe, the surrounding price action and the way the trader manages uncertainty.
Why dashboards can help, and when they become distracting
A dashboard can give a quick summary of several conditions, such as trend or momentum across more than one timeframe. This may be helpful when a trader wants a structured checklist before examining the chart in detail. It can also support consistency by encouraging the same questions during each review.
At the same time, a dashboard should not replace the chart. A compact summary may hide the details that explain why a condition is being shown. Learners should use the dashboard to organise attention, then return to price structure and assess whether the displayed context makes sense.
How to avoid overloading a TradingView chart
Chart overload happens when every available feature is treated as essential. The solution is not necessarily to use a completely empty chart. Instead, decide which information is needed for the current learning objective and hide features that do not contribute to it.
- Choose one primary question. Decide whether the session is focused on structure, trend, momentum or another clearly defined topic.
- Make market structure visible first. Display the swing and structure features needed to understand the sequence of price movement.
- Add only supporting context. If trend or momentum is relevant, include it in a restrained way rather than adding several tools that measure similar conditions.
- Reduce visual competition. Use configurable settings to limit labels, lines, colours or alerts that do not help with the current analysis.
- Review one timeframe at a time. Use higher-timeframe information for context, then examine the lower timeframe without confusing every signal as equally important.
- Record the reasoning. Write down what the indicator showed, what price actually did and which parts of the interpretation were uncertain.
This process turns an indicator into a learning aid rather than a source of constant instructions. It also makes it easier to identify which features are genuinely useful and which simply create more visual noise.
Comparing separate indicators with a combined TradingView tool
Using separate indicators can be appropriate when a trader wants to learn each concept independently. A standalone structure tool may make it easier to study swing relationships, while a separate momentum tool can isolate the behaviour of price strength. This approach can be educational because it makes the role of each tool explicit.
The disadvantage is that several separate studies can create duplicated signals and competing visual language. A combined tool may offer a more organised way to review related conditions, particularly when it includes configurable displays. The trade-off is that the trader must learn how the combined features relate to each other rather than assuming the overall dashboard is a single answer.
| Approach | Best suited to | What to watch for |
|---|---|---|
| One structure-focused indicator | Beginners learning swing points, BOS and CHoCH | Do not interpret every label as a trade signal |
| Several separate indicators | Traders studying concepts independently | Overlapping calculations and competing signals |
| Combined smart money indicator | Traders wanting structure, trend, momentum and flow context in one tool | Learn each component and customise the display |
| Indicator with alerts | Traders who want to monitor defined conditions | Alerts require review and do not guarantee a valid setup |
There is no universal best configuration. The most appropriate choice depends on the learner’s experience, the amount of information they can interpret consistently and the specific question being studied. A simple setup that is understood is generally more useful than a sophisticated setup that is ignored or misunderstood.
Using alerts without turning them into automatic decisions
Configurable TradingView alerts can help traders notice selected conditions without watching a chart continuously. For example, a trader may use alerts to review a structure event or a chosen indicator state. This can make a study routine more practical, especially when the trader has already defined what the alert means and what additional checks are required.
An alert is a notification, not a complete analysis. Before treating an alert as relevant, review the timeframe, market structure, trend context, momentum and volatility. Also consider whether the event occurred during a period of unusual movement or simply reflects a small fluctuation. This additional review helps prevent the alert from becoming an automatic buy or sell instruction.
A practical learning workflow for a less crowded chart
A repeatable workflow can make the best trading indicators TradingView offers easier to evaluate. Begin with a clean view of price and identify the important swing points. Then use the market structure features to describe the current sequence. After that, check the higher-timeframe trend and review momentum or relative strength as supporting context.
Next, examine market flow or smart money information if it is part of the selected tool. Ask whether it adds a useful perspective or merely repeats what the structure already shows. If Fibonacci projections or volatility-based target and risk reference levels are displayed, treat them as areas for study rather than fixed predictions.
Questions to ask during each review
- What is the dominant structure on the timeframe being studied?
- Which recent event changed or confirmed the way price is being described?
- Does the broader trend agree with the local structure, or is there a conflict?
- Is momentum supporting the current movement or showing reduced strength?
- Does market flow add context that is not already visible?
- Which displayed features can be hidden without reducing understanding?
- What would invalidate the current interpretation?
These questions keep the focus on interpretation instead of on collecting signals. They also reinforce an important distinction: an indicator can organise information, but the trader remains responsible for evaluating the information and managing risk.
How to assess an indicator before relying on it
Before adopting any TradingView trading indicator, spend time learning its terminology, settings and display logic. Review historical charts for education and observe how the indicator describes different types of movement. Pay attention to whether labels change as new price information appears and whether the tool is being used within the timeframe for which it makes sense.
It is also useful to compare the indicator’s readings with the underlying chart rather than judging it only by how attractive the display looks. A tool can be visually clear yet still be misunderstood. The goal is to know what each feature represents, what it does not represent and which parts require independent confirmation.
VP ALGO TRADING positions its indicators and trading software as tools for analysis and decision-making assistance, not as financial advice. Anyone using an indicator should carry out their own research, understand the risks involved and avoid treating projected levels, alerts or structure labels as guaranteed outcomes.
Final guidance: choose clarity over quantity
The best trading indicators TradingView users can choose are not necessarily the ones with the greatest number of signals. For learning market structure, prioritise a clear view of swings, breaks and possible changes in behaviour. Add trend, momentum, flow and volatility information only when each feature answers a specific question.
AKMelytics – Smart Money Indicator may suit traders who want a structured TradingView tool combining market structure, momentum, trend analysis, market flow, relative strength and smart money concepts. Its configurable features can be studied gradually rather than displayed all at once. Whether you use a combined tool or separate indicators, the central objective remains the same: create a chart that supports careful reasoning instead of encouraging automatic decisions.
Frequently asked questions
What is the best trading indicator for learning market structure?
A market structure indicator that clearly shows swing points, breaks of structure and possible changes of character can be a useful starting point. The best choice is the one whose labels and settings you understand and can interpret alongside price action.
Can a smart money indicator predict the market?
No indicator should be treated as a guaranteed prediction tool. A smart money indicator can organise market structure, flow and related context, but future price behaviour remains uncertain.
What does a BOS label mean?
BOS generally refers to a break of structure, where price moves beyond a relevant structural point. It is an analytical event that requires context and does not automatically confirm that a trend will continue.
What does CHoCH mean on a TradingView indicator?
CHoCH generally means change of character. It highlights a possible change in price behaviour, but it should be reviewed with the timeframe, surrounding structure and broader market context.
How many indicators should be on a TradingView chart?
There is no universal number. Use enough tools to answer the questions in your analysis and remove features that duplicate information or make the chart difficult to read.
Are TradingView alerts buy and sell signals?
Alerts notify you that a selected condition has occurred. They are not a substitute for reviewing structure, trend, momentum, volatility and risk, and they do not guarantee a particular trading outcome.
Does AKMelytics include more than market structure analysis?
Yes. The stated features include momentum, trend analysis, market structure, market flow, relative strength, smart money concepts, multi-timeframe analysis, Fibonacci projections, volatility-based reference levels, dashboard context and configurable TradingView alerts.


Recent Comments