
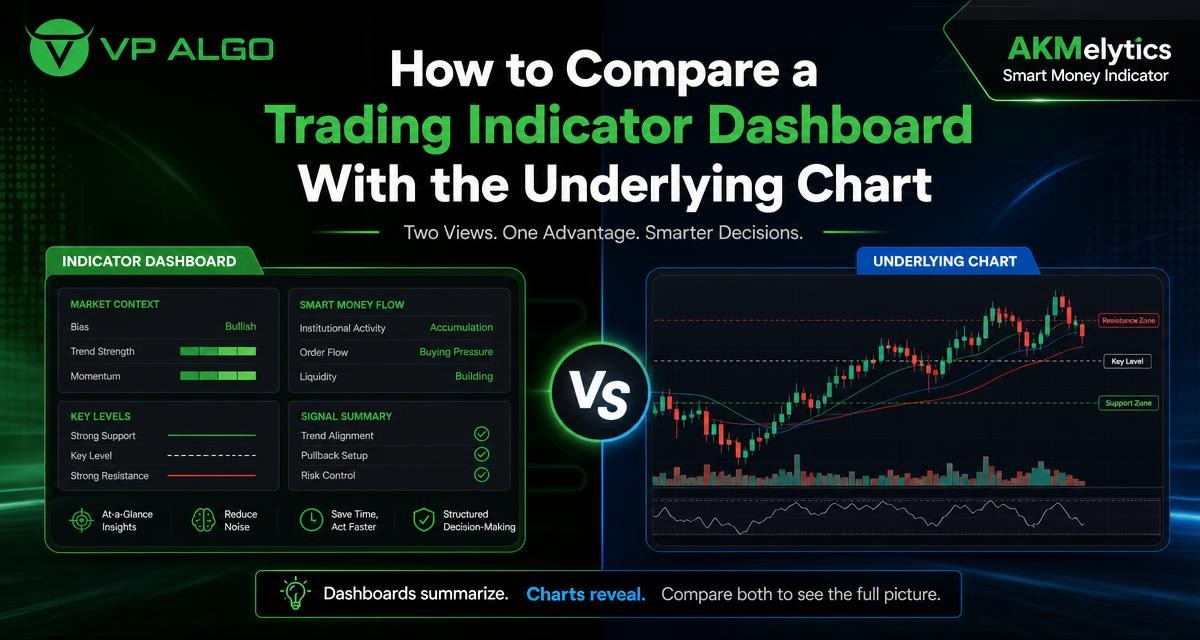
A TradingView trading indicator can present a large amount of market information in a compact dashboard, while the underlying chart shows the price action that produced that information. Comparing the two views helps traders understand what an indicator is summarizing, identify agreement or disagreement, and make stock technical analysis more deliberate rather than relying on a single visual prompt.
Why compare the dashboard with the chart?
A dashboard is designed to reduce visual clutter. Instead of asking you to inspect several timeframes, structure events and momentum readings one by one, it can arrange selected conditions in a quick reference panel. This is useful when you are scanning charts or trying to form an initial view of market conditions.
The chart remains the source of the price information. Candles, swings, highs and lows, gaps, ranges and reactions around important levels provide the context behind a dashboard reading. A summary may tell you that a trend or momentum condition is present, but the chart can show whether that condition developed after a sharp move, inside a narrow range or near an area where price has repeatedly reacted.
Neither view should automatically replace the other. The dashboard supports efficient review; the chart supports interpretation. Treating them as separate stages of the same analysis can help prevent a brief summary from becoming an isolated buy or sell decision.
What a trading indicator dashboard can summarize
The exact information depends on the TradingView trading indicator and its configuration. A tool such as the AKMelytics – Smart Money Indicator is designed to bring together areas including trend analysis, momentum, market structure, market flow, relative strength and smart money concepts. It also includes multi-timeframe analysis, structure events such as BOS and CHoCH, Fibonacci projections, volatility-based target and risk reference levels, dashboard context and configurable alerts.
These features can make a review more structured, but a summary still needs to be read in context. A dashboard cell, label or status normally represents a defined calculation or set of conditions. It does not describe every feature of the current price action. Before using a reading, establish what it measures, which timeframe it represents and whether it is intended as confirmation, an alert or simply a screening aid.
Common dashboard questions
- What condition is being summarized? It may relate to trend direction, momentum, structure, flow or another calculated input.
- Which timeframe is being shown? A higher-timeframe trend reading may not match the short-term chart.
- How current is the reading? Conditions can change as new candles form and as price develops.
- Is the display confirming or triggering? A dashboard can organize evidence without being a complete trading plan.
What direct chart inspection reveals
Direct inspection starts with the candles and the sequence of price movement. It allows you to see whether the market is making higher highs and higher lows, lower highs and lower lows, or moving sideways between recognizable boundaries. It also helps you judge the quality of a move: a sustained expansion, a brief spike and rejection, or a slow drift through a range may all produce different implications even if a summary uses similar wording.
Chart inspection is also where location becomes visible. A momentum reading near the middle of a range may deserve a different response from the same reading near a prior swing high or low. Likewise, a change in market structure may be more meaningful when it follows a clear attempt to break a level than when it occurs amid overlapping candles and limited directional movement.
Chart features worth checking
- Recent swing highs and swing lows.
- The width and boundaries of the current range.
- Whether price is expanding, retracing or consolidating.
- Reactions around visible support and resistance areas.
- The size of recent candles relative to nearby candles.
- Potential conflicts between the selected timeframe and broader market structure.
- Whether a signal appeared before, during or after a substantial price move.
Dashboard summary versus underlying chart
The two views answer different questions. The dashboard is often better for asking, “Which conditions deserve attention?” The underlying chart is better for asking, “What is price actually doing, and where is it doing it?” A useful review moves from the first question to the second instead of stopping at the summary.
| Review area | Dashboard view | Underlying chart view |
|---|---|---|
| Trend | Condenses directional or multi-timeframe readings | Shows the sequence of swings and the pace of the move |
| Momentum | Highlights a calculated strength or weakness condition | Shows candle expansion, follow-through and failed continuation |
| Market structure | May identify events such as BOS or CHoCH | Shows the swing points and price action behind the event |
| Flow or smart money context | Organizes selected flow-related conditions | Shows reactions, displacement, pauses and areas of acceptance or rejection |
| Multi-timeframe analysis | Places several timeframe readings together | Lets you inspect how the timeframes relate to actual price levels |
| Risk references | May provide volatility-based reference levels | Shows whether those levels fit the current structure and chart space |
This is not a contest in which one side must win. A dashboard can improve consistency by ensuring that certain conditions are checked. The chart can challenge an overly simple interpretation by showing location, volatility and structure that a compact panel cannot fully explain.
A practical comparison process
1. Begin with the higher-timeframe chart
Before reading short-term dashboard conditions, inspect the broader chart available for your analysis. Mark the most recent meaningful swings and describe the market in plain language: trending upward, trending downward, ranging, or unclear. This first description does not need to predict the next move. Its purpose is to establish context.
Then compare that view with the dashboard’s multi-timeframe information. If the dashboard shows different conditions across timeframes, do not treat the difference as an error. A market can have a broader upward structure and a short-term downward retracement at the same time. The task is to understand the relationship rather than force every timeframe into one direction.
2. Read the dashboard without jumping to a conclusion
Review the displayed trend, momentum, structure and other relevant fields. Note which readings agree and which do not. For example, a strong trend reading paired with weaker short-term momentum may indicate that the broader direction and immediate price behavior are not identical. That observation is more useful than treating one favorable label as sufficient confirmation.
At this stage, write down what the dashboard is saying in neutral terms. “Momentum is improving on the selected timeframe” is more precise than “the market is ready to rise.” Neutral wording helps keep the analysis separate from an unsupported outcome claim.
3. Locate the dashboard event on the chart
If the indicator identifies a break of structure, change of character, momentum shift or another event, find the corresponding area on the underlying chart. Ask which swing was broken, how far price moved afterward and whether the event occurred inside a clean directional move or a crowded range.
This step is particularly useful for a market structure indicator. BOS and CHoCH labels are easier to evaluate when you can see the swing points used by the calculation. The chart may show that an event is developing near a meaningful level, or that it occurred in a noisy area where follow-through has been limited.
4. Compare timing and location
Timing tells you when a dashboard condition appeared. Location tells you where price was when it appeared. Both matter. A momentum reading that arrives after several large candles may describe existing strength rather than an early opportunity. A structure event near a prior extreme may require a different review from one occurring in the center of a broad range.
Use the chart to consider whether the displayed condition is early, developing, mature or potentially invalidated by subsequent price action. This does not make the indicator useless when conditions change. It simply recognizes that market analysis is performed on evolving information.
5. Check the next candle sequence
Instead of focusing only on the candle that produced a label, inspect what happened afterward. Did price continue in the same direction, pause, retrace or move back through the level? This review can improve your understanding of how the indicator behaves in different chart environments, without assuming that any historical response will guarantee a future result.
Keeping a neutral journal can help. Record the timeframe, dashboard readings, chart context and subsequent development. The purpose is to learn how the tool and the chart complement each other, not to manufacture a performance promise from selected examples.
How to interpret disagreement between the two views
Disagreement is not automatically a fault. It may occur because the dashboard summarizes multiple inputs while the chart displays raw price movement. It may also reflect different timeframes, calculation settings or the fact that a condition is changing as a candle forms.
Trend agrees, momentum disagrees
A broad trend can remain intact while short-term momentum weakens during a pullback. On the chart, look for whether the retracement is orderly or whether it is breaking important swing points. The dashboard provides a prompt to investigate; the chart provides the detail needed to classify the movement.
Momentum agrees, structure disagrees
Price can accelerate briefly without changing the broader structure. Inspect the nearest swing levels and ask whether the move has produced meaningful follow-through. Strong candles alone do not explain whether the market has left a range or simply tested its boundary.
Dashboard values change during an open candle
Conditions can update while price is moving. A reading seen before a candle closes may not be identical after the candle closes. For disciplined comparison, note whether you are reviewing developing or completed candles and apply the same approach consistently. The indicator should be understood through its documented behavior and your own chart review, not through a single changing snapshot.
Using an indicator without outsourcing judgment
A TradingView trading indicator is best treated as an analytical aid. It can organize information, draw attention to possible conditions and make a repeatable review process easier. It cannot remove uncertainty from the market or decide whether a particular situation fits your objectives, experience and risk tolerance.
For that reason, avoid turning dashboard states into automatic commands. A label that suggests bullish or bearish conditions should lead to questions about structure, location, timeframe and invalidation. It should not be read as a guarantee of a particular market outcome. VP ALGO TRADING positions its indicators as tools for educational and trading-decision assistance, not as financial advice.
A simple review checklist
- Identify the chart timeframe and the broader context.
- Read the dashboard conditions without making an immediate prediction.
- Find each important event or signal on the underlying chart.
- Check nearby swing points, range boundaries and price reactions.
- Compare higher-timeframe and lower-timeframe information.
- Decide whether the conditions are aligned, mixed or unclear.
- Document the reasoning and review how the chart develops later.
How AKMelytics can fit into this workflow
AKMelytics – Smart Money Indicator is a TradingView technical analysis tool that combines inputs related to momentum, trend analysis, market structure, market flow, relative strength and smart money concepts. Its dashboard and multi-timeframe features can help organize the first stage of a chart review, while structure events, Fibonacci projections, volatility-based reference levels and alerts can direct attention to areas that deserve closer inspection.
The underlying chart should still be reviewed separately. Examine the candles and swings behind any displayed event, consider whether the timeframe is appropriate, and decide how the information fits into your own analytical process. The tool is intended to support the evaluation of potential trading setups and decision-making; it does not guarantee results or provide financial advice.
Final perspective
The most useful comparison is not dashboard versus chart as competing methods. It is dashboard for organization and chart for context. When the two agree, you have a clearer description of the current conditions. When they disagree, you have a reason to investigate timeframe, timing, location, structure and calculation behavior before drawing a conclusion.
This approach can make stock technical analysis more disciplined. Rather than treating a TradingView trading indicator as an answer, use it to create better questions, then return to the underlying chart for the evidence and context that a summary cannot fully display.
Frequently asked questions
What is the main purpose of a trading indicator dashboard?
A dashboard organizes selected market conditions in a compact format. It can help traders scan trend, momentum, structure and related readings before inspecting the underlying chart in greater detail.
Should the dashboard or the chart be trusted more?
They serve different purposes. The dashboard summarizes calculated conditions, while the chart shows the price action behind them. Reviewing both provides more context than relying on either view alone.
Why can a dashboard and chart appear to disagree?
Differences can result from separate timeframes, changing candle data, calculation settings or the fact that a summary cannot display every detail of price action. Disagreement is a prompt for further review, not automatically an error.
What should I check after a BOS or CHoCH label appears?
Locate the event on the chart and inspect the swing points involved, the distance price moved, nearby levels and subsequent follow-through. This helps you understand the event in its actual market context.
Can a momentum reading confirm a trading decision by itself?
A momentum reading is one part of analysis. Review trend, structure, price location, timeframe and your own risk process before considering what the reading means for a potential setup.
Is AKMelytics – Smart Money Indicator financial advice?
No. It is a TradingView technical analysis tool intended to support educational review and trading-decision assistance. It does not provide official financial advice or guarantee a particular result.
How can I learn whether the indicator fits my analysis process?
Use a consistent comparison process: read the dashboard, locate its conditions on the chart, record the context and review how price develops. This can help you decide whether the tool supports your own method of analysis.


Recent Comments